
August 7, 2018 Primary Results

Congressional District 2 - U.S. Representative - County Results
Last updated on 08/21/2018 4:39 PM
Total
64.85%
Rick Larsen(Prefers Democratic Party)
101,497
7.87%
Brian Luke(Prefers Libertarian Party)
12,320
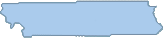
Island County
63.25%
Rick Larsen14,959
11.04%
Uncle Mover2,612
08/21/2018 9:51 AM
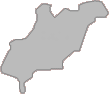
San Juan County
68.06%
Rick Larsen4,416
8.66%
Gary Franco562
08/20/2018 5:42 PM
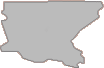
Skagit County
65.05%
Rick Larsen11,434
9.36%
Uncle Mover1,646
08/21/2018 1:48 PM
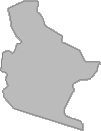
Snohomish County
62.81%
Rick Larsen50,094
9.02%
Collin Richard Carlson7,190
08/21/2018 12:53 PM
Whatcom County
70.94%
Rick Larsen20,594
9.31%
Stonewall Jackson Bird (Stoney)2,702
08/20/2018 5:01 PM


| Congressional District 2 - U.S. Representative | |||
| County | Candidate | Vote | Vote % |
|---|---|---|---|
| Island | |||
(Prefers Democratic Party) | 1,388 | 5.87% | |
(Prefers Moderate GOP Party) | 2,612 | 11.04% | |
(Prefers Libertarian Party) | 1,975 | 8.35% | |
(Prefers Green Party) | 758 | 3.21% | |
(Prefers Democratic Party) | 14,959 | 63.25% | |
(Prefers Independent Party) | 1,957 | 8.28% | |
| Total Votes (not including write-ins) | 23,649 | ||
| San Juan | |||
(Prefers Democratic Party) | 510 | 7.86% | |
(Prefers Moderate GOP Party) | 263 | 4.05% | |
(Prefers Libertarian Party) | 331 | 5.1% | |
(Prefers Green Party) | 406 | 6.26% | |
(Prefers Democratic Party) | 4,416 | 68.06% | |
(Prefers Independent Party) | 562 | 8.66% | |
| Total Votes (not including write-ins) | 6,488 | ||
| Skagit | |||
(Prefers Democratic Party) | 1,038 | 5.91% | |
(Prefers Moderate GOP Party) | 1,646 | 9.36% | |
(Prefers Libertarian Party) | 1,380 | 7.85% | |
(Prefers Green Party) | 479 | 2.72% | |
(Prefers Democratic Party) | 11,434 | 65.05% | |
(Prefers Independent Party) | 1,601 | 9.11% | |
| Total Votes (not including write-ins) | 17,578 | ||
| Snohomish | |||
(Prefers Democratic Party) | 7,190 | 9.02% | |
(Prefers Moderate GOP Party) | 6,426 | 8.06% | |
(Prefers Libertarian Party) | 6,996 | 8.77% | |
(Prefers Green Party) | 2,180 | 2.73% | |
(Prefers Democratic Party) | 50,094 | 62.81% | |
(Prefers Independent Party) | 6,868 | 8.61% | |
| Total Votes (not including write-ins) | 79,754 | ||
| Whatcom | |||
(Prefers Democratic Party) | 1,932 | 6.65% | |
(Prefers Moderate GOP Party) | 885 | 3.05% | |
(Prefers Libertarian Party) | 1,638 | 5.64% | |
(Prefers Green Party) | 2,702 | 9.31% | |
(Prefers Democratic Party) | 20,594 | 70.94% | |
(Prefers Independent Party) | 1,281 | 4.41% | |
| Total Votes (not including write-ins) | 29,032 | ||