


August 17, 2010 Primary Results
Congressional District 3 - U.S. Representative - County Results
Last updated on 09/03/2010 8:30 AM
Total
31.4%
Denny Heck51,895
27.83%
Jaime Herrera46,001
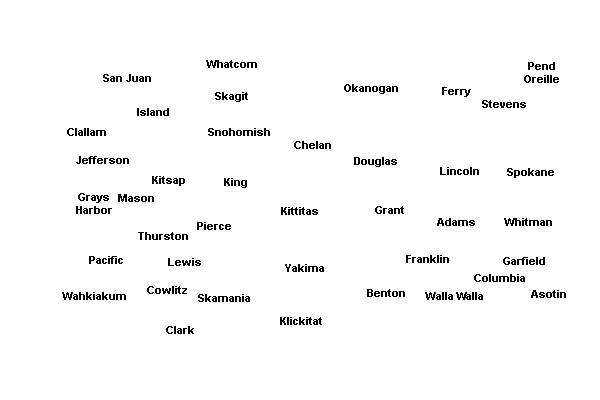
Clark County
31.34%
Jaime Herrera25,568
31.05%
Denny Heck25,325
Cowlitz County
33.81%
Jaime Herrera6,975
28.04%
Denny Heck5,785
Lewis County
26.32%
Jaime Herrera4,811
23.67%
David B. Castillo4,326
Pacific County
37.11%
Denny Heck2,489
23.08%
Jaime Herrera1,548
Skamania County
27.4%
Denny Heck526
22.45%
Jaime Herrera431
Thurston County
39.31%
Denny Heck13,637
17.86%
Jaime Herrera6,198
Wahkiakum County
31.86%
Jaime Herrera470
30.24%
Denny Heck446


| Congressional District 3 - U.S. Representative | |||
| County | Candidate | Vote | Vote % |
|---|---|---|---|
| Clark | |||
(Prefers Democratic Party) | 7,164 | 8.78% | |
(Prefers Republican Party) | 8,341 | 10.23% | |
(Prefers Republican Party) | 13,087 | 16.04% | |
(Prefers Democratic Party) | 25,325 | 31.05% | |
(Prefers Republican Party) | 25,568 | 31.34% | |
(Prefers Independent Party) | 2,085 | 2.56% | |
| Total Votes | 81,570 | 100% | |
| Cowlitz | |||
(Prefers Democratic Party) | 3,004 | 14.56% | |
(Prefers Republican Party) | 1,869 | 9.06% | |
(Prefers Republican Party) | 1,884 | 9.13% | |
(Prefers Democratic Party) | 5,785 | 28.04% | |
(Prefers Republican Party) | 6,975 | 33.81% | |
(Prefers Independent Party) | 1,111 | 5.39% | |
| Total Votes | 20,628 | 100% | |
| Lewis | |||
(Prefers Democratic Party) | 1,413 | 7.73% | |
(Prefers Republican Party) | 4,326 | 23.67% | |
(Prefers Republican Party) | 3,113 | 17.03% | |
(Prefers Democratic Party) | 3,687 | 20.17% | |
(Prefers Republican Party) | 4,811 | 26.32% | |
(Prefers Independent Party) | 929 | 5.08% | |
| Total Votes | 18,279 | 100% | |
| Pacific | |||
(Prefers Democratic Party) | 922 | 13.75% | |
(Prefers Republican Party) | 573 | 8.54% | |
(Prefers Republican Party) | 604 | 9.01% | |
(Prefers Democratic Party) | 2,489 | 37.11% | |
(Prefers Republican Party) | 1,548 | 23.08% | |
(Prefers Independent Party) | 571 | 8.51% | |
| Total Votes | 6,707 | 100% | |
| Skamania | |||
(Prefers Democratic Party) | 271 | 14.11% | |
(Prefers Republican Party) | 204 | 10.62% | |
(Prefers Republican Party) | 351 | 18.28% | |
(Prefers Democratic Party) | 526 | 27.4% | |
(Prefers Republican Party) | 431 | 22.45% | |
(Prefers Independent Party) | 137 | 7.14% | |
| Total Votes | 1,920 | 100% | |
| Thurston | |||
(Prefers Democratic Party) | 5,479 | 15.79% | |
(Prefers Republican Party) | 4,546 | 13.1% | |
(Prefers Republican Party) | 3,446 | 9.93% | |
(Prefers Democratic Party) | 13,637 | 39.31% | |
(Prefers Republican Party) | 6,198 | 17.86% | |
(Prefers Independent Party) | 1,389 | 4% | |
| Total Votes | 34,695 | 100% | |
| Wahkiakum | |||
(Prefers Democratic Party) | 200 | 13.56% | |
(Prefers Republican Party) | 136 | 9.22% | |
(Prefers Republican Party) | 136 | 9.22% | |
(Prefers Democratic Party) | 446 | 30.24% | |
(Prefers Republican Party) | 470 | 31.86% | |
(Prefers Independent Party) | 87 | 5.9% | |
| Total Votes | 1,475 | 100% | |