


November 04, 2008 General Election Results
Secretary of State - County Results
Last updated on 11/26/2008 9:41 AM
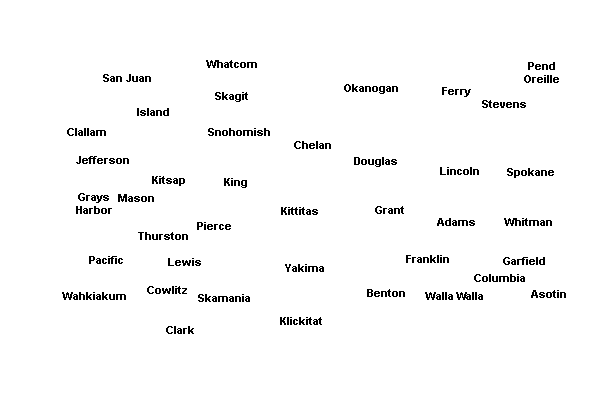
The boxes identify the two candidates receiving the most votes. The map displays the top vote-getter by county, which may include candidates other than the two receiving the most votes overall.
Total
58.33%
Sam Reed(Prefers Republican Party)
1,644,587
41.67%
Jason Osgood(Prefers Democratic Party)
1,175,086
Adams County
74.6%
Sam Reed3,372
25.4%
Jason Osgood1,148
Asotin County
62.64%
Sam Reed5,727
37.36%
Jason Osgood3,416
Benton County
71.96%
Sam Reed49,619
28.04%
Jason Osgood19,330
Chelan County
69.7%
Sam Reed20,913
30.3%
Jason Osgood9,093
Clallam County
61.12%
Sam Reed22,048
38.88%
Jason Osgood14,025
Clark County
57.02%
Sam Reed97,002
42.98%
Jason Osgood73,119
Columbia County
75.08%
Sam Reed1,558
24.92%
Jason Osgood517
Cowlitz County
53.9%
Sam Reed22,850
46.1%
Jason Osgood19,543
Douglas County
71.12%
Sam Reed10,207
28.88%
Jason Osgood4,145
Ferry County
63.34%
Sam Reed2,070
36.66%
Jason Osgood1,198
Franklin County
68.84%
Sam Reed13,009
31.16%
Jason Osgood5,889
Garfield County
76.57%
Sam Reed964
23.43%
Jason Osgood295
Grant County
68.83%
Sam Reed17,968
31.17%
Jason Osgood8,138
Grays Harbor County
57.67%
Sam Reed15,940
42.33%
Jason Osgood11,698
Island County
62.2%
Sam Reed24,352
37.8%
Jason Osgood14,802
Jefferson County
50.06%
Sam Reed9,447
49.94%
Jason Osgood9,423
King County
51.88%
Sam Reed432,277
48.12%
Jason Osgood400,964
Kitsap County
58.89%
Sam Reed68,976
41.11%
Jason Osgood48,153
Kittitas County
66.42%
Sam Reed11,120
33.58%
Jason Osgood5,621
Klickitat County
57.09%
Sam Reed5,402
42.91%
Jason Osgood4,060
Lewis County
68.4%
Sam Reed22,415
31.6%
Jason Osgood10,354
Lincoln County
74.64%
Sam Reed4,147
25.36%
Jason Osgood1,409
Mason County
62.55%
Sam Reed16,933
37.45%
Jason Osgood10,140
Okanogan County
62.6%
Sam Reed9,818
37.4%
Jason Osgood5,865
Pacific County
52.96%
Sam Reed5,423
47.04%
Jason Osgood4,817
Pend Oreille County
65.56%
Sam Reed4,014
34.44%
Jason Osgood2,109
Pierce County
59.8%
Sam Reed183,413
40.2%
Jason Osgood123,283
San Juan County
51.57%
Jason Osgood5,058
48.43%
Sam Reed4,750
Skagit County
61.18%
Sam Reed32,077
38.82%
Jason Osgood20,355
Skamania County
55.79%
Sam Reed2,833
44.21%
Jason Osgood2,245
Snohomish County
57.13%
Sam Reed172,173
42.87%
Jason Osgood129,193
Spokane County
62.62%
Sam Reed129,876
37.38%
Jason Osgood77,532
Stevens County
67.3%
Sam Reed14,077
32.7%
Jason Osgood6,839
Thurston County
65.94%
Sam Reed79,212
34.06%
Jason Osgood40,915
Wahkiakum County
59.1%
Sam Reed1,260
40.9%
Jason Osgood872
Walla Walla County
70.24%
Sam Reed16,195
29.76%
Jason Osgood6,863
Whatcom County
56.49%
Sam Reed53,006
43.51%
Jason Osgood40,820
Whitman County
62.04%
Sam Reed10,058
37.96%
Jason Osgood6,154
Yakima County
65.18%
Sam Reed48,086
34.82%
Jason Osgood25,686


| Secretary of State | |||
| County | Candidate | Vote | Vote % |
|---|---|---|---|
| Adams | |||
(Prefers Democratic Party) | 1,148 | 25.4% | |
(Prefers Republican Party) | 3,372 | 74.6% | |
| Total Votes | 4,520 | 100% | |
| Asotin | |||
(Prefers Democratic Party) | 3,416 | 37.36% | |
(Prefers Republican Party) | 5,727 | 62.64% | |
| Total Votes | 9,143 | 100% | |
| Benton | |||
(Prefers Democratic Party) | 19,330 | 28.04% | |
(Prefers Republican Party) | 49,619 | 71.96% | |
| Total Votes | 68,949 | 100% | |
| Chelan | |||
(Prefers Democratic Party) | 9,093 | 30.3% | |
(Prefers Republican Party) | 20,913 | 69.7% | |
| Total Votes | 30,006 | 100% | |
| Clallam | |||
(Prefers Democratic Party) | 14,025 | 38.88% | |
(Prefers Republican Party) | 22,048 | 61.12% | |
| Total Votes | 36,073 | 100% | |
| Clark | |||
(Prefers Democratic Party) | 73,119 | 42.98% | |
(Prefers Republican Party) | 97,002 | 57.02% | |
| Total Votes | 170,121 | 100% | |
| Columbia | |||
(Prefers Democratic Party) | 517 | 24.92% | |
(Prefers Republican Party) | 1,558 | 75.08% | |
| Total Votes | 2,075 | 100% | |
| Cowlitz | |||
(Prefers Democratic Party) | 19,543 | 46.1% | |
(Prefers Republican Party) | 22,850 | 53.9% | |
| Total Votes | 42,393 | 100% | |
| Douglas | |||
(Prefers Democratic Party) | 4,145 | 28.88% | |
(Prefers Republican Party) | 10,207 | 71.12% | |
| Total Votes | 14,352 | 100% | |
| Ferry | |||
(Prefers Democratic Party) | 1,198 | 36.66% | |
(Prefers Republican Party) | 2,070 | 63.34% | |
| Total Votes | 3,268 | 100% | |
| Franklin | |||
(Prefers Democratic Party) | 5,889 | 31.16% | |
(Prefers Republican Party) | 13,009 | 68.84% | |
| Total Votes | 18,898 | 100% | |
| Garfield | |||
(Prefers Democratic Party) | 295 | 23.43% | |
(Prefers Republican Party) | 964 | 76.57% | |
| Total Votes | 1,259 | 100% | |
| Grant | |||
(Prefers Democratic Party) | 8,138 | 31.17% | |
(Prefers Republican Party) | 17,968 | 68.83% | |
| Total Votes | 26,106 | 100% | |
| Grays Harbor | |||
(Prefers Democratic Party) | 11,698 | 42.33% | |
(Prefers Republican Party) | 15,940 | 57.67% | |
| Total Votes | 27,638 | 100% | |
| Island | |||
(Prefers Democratic Party) | 14,802 | 37.8% | |
(Prefers Republican Party) | 24,352 | 62.2% | |
| Total Votes | 39,154 | 100% | |
| Jefferson | |||
(Prefers Democratic Party) | 9,423 | 49.94% | |
(Prefers Republican Party) | 9,447 | 50.06% | |
| Total Votes | 18,870 | 100% | |
| King | |||
(Prefers Democratic Party) | 400,964 | 48.12% | |
(Prefers Republican Party) | 432,277 | 51.88% | |
| Total Votes | 833,241 | 100% | |
| Kitsap | |||
(Prefers Democratic Party) | 48,153 | 41.11% | |
(Prefers Republican Party) | 68,976 | 58.89% | |
| Total Votes | 117,129 | 100% | |
| Kittitas | |||
(Prefers Democratic Party) | 5,621 | 33.58% | |
(Prefers Republican Party) | 11,120 | 66.42% | |
| Total Votes | 16,741 | 100% | |
| Klickitat | |||
(Prefers Democratic Party) | 4,060 | 42.91% | |
(Prefers Republican Party) | 5,402 | 57.09% | |
| Total Votes | 9,462 | 100% | |
| Lewis | |||
(Prefers Democratic Party) | 10,354 | 31.6% | |
(Prefers Republican Party) | 22,415 | 68.4% | |
| Total Votes | 32,769 | 100% | |
| Lincoln | |||
(Prefers Democratic Party) | 1,409 | 25.36% | |
(Prefers Republican Party) | 4,147 | 74.64% | |
| Total Votes | 5,556 | 100% | |
| Mason | |||
(Prefers Democratic Party) | 10,140 | 37.45% | |
(Prefers Republican Party) | 16,933 | 62.55% | |
| Total Votes | 27,073 | 100% | |
| Okanogan | |||
(Prefers Democratic Party) | 5,865 | 37.4% | |
(Prefers Republican Party) | 9,818 | 62.6% | |
| Total Votes | 15,683 | 100% | |
| Pacific | |||
(Prefers Democratic Party) | 4,817 | 47.04% | |
(Prefers Republican Party) | 5,423 | 52.96% | |
| Total Votes | 10,240 | 100% | |
| Pend Oreille | |||
(Prefers Democratic Party) | 2,109 | 34.44% | |
(Prefers Republican Party) | 4,014 | 65.56% | |
| Total Votes | 6,123 | 100% | |
| Pierce | |||
(Prefers Democratic Party) | 123,283 | 40.2% | |
(Prefers Republican Party) | 183,413 | 59.8% | |
| Total Votes | 306,696 | 100% | |
| San Juan | |||
(Prefers Democratic Party) | 5,058 | 51.57% | |
(Prefers Republican Party) | 4,750 | 48.43% | |
| Total Votes | 9,808 | 100% | |
| Skagit | |||
(Prefers Democratic Party) | 20,355 | 38.82% | |
(Prefers Republican Party) | 32,077 | 61.18% | |
| Total Votes | 52,432 | 100% | |
| Skamania | |||
(Prefers Democratic Party) | 2,245 | 44.21% | |
(Prefers Republican Party) | 2,833 | 55.79% | |
| Total Votes | 5,078 | 100% | |
| Snohomish | |||
(Prefers Democratic Party) | 129,193 | 42.87% | |
(Prefers Republican Party) | 172,173 | 57.13% | |
| Total Votes | 301,366 | 100% | |
| Spokane | |||
(Prefers Democratic Party) | 77,532 | 37.38% | |
(Prefers Republican Party) | 129,876 | 62.62% | |
| Total Votes | 207,408 | 100% | |
| Stevens | |||
(Prefers Democratic Party) | 6,839 | 32.7% | |
(Prefers Republican Party) | 14,077 | 67.3% | |
| Total Votes | 20,916 | 100% | |
| Thurston | |||
(Prefers Democratic Party) | 40,915 | 34.06% | |
(Prefers Republican Party) | 79,212 | 65.94% | |
| Total Votes | 120,127 | 100% | |
| Wahkiakum | |||
(Prefers Democratic Party) | 872 | 40.9% | |
(Prefers Republican Party) | 1,260 | 59.1% | |
| Total Votes | 2,132 | 100% | |
| Walla Walla | |||
(Prefers Democratic Party) | 6,863 | 29.76% | |
(Prefers Republican Party) | 16,195 | 70.24% | |
| Total Votes | 23,058 | 100% | |
| Whatcom | |||
(Prefers Democratic Party) | 40,820 | 43.51% | |
(Prefers Republican Party) | 53,006 | 56.49% | |
| Total Votes | 93,826 | 100% | |
| Whitman | |||
(Prefers Democratic Party) | 6,154 | 37.96% | |
(Prefers Republican Party) | 10,058 | 62.04% | |
| Total Votes | 16,212 | 100% | |
| Yakima | |||
(Prefers Democratic Party) | 25,686 | 34.82% | |
(Prefers Republican Party) | 48,086 | 65.18% | |
| Total Votes | 73,772 | 100% | |