


November 04, 2008 General Election Results
Legislative District 9 - State Representative Pos. 1 - County Results
Last updated on 11/26/2008 9:41 AM
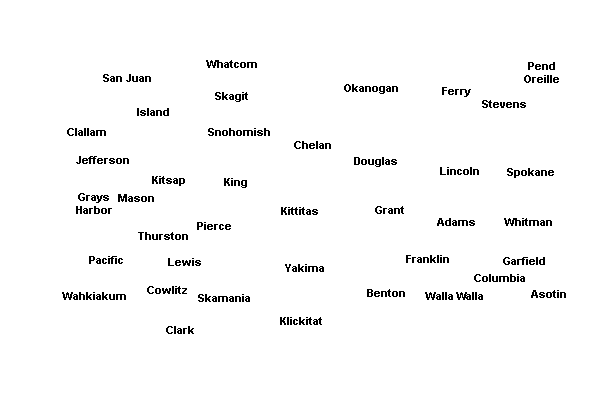
The boxes identify the two candidates receiving the most votes. The map displays the top vote-getter by county, which may include candidates other than the two receiving the most votes overall.
Total
65.06%
Steve Hailey(Prefers G.O.P. Party)
32,022
34.94%
Kenneth E. Caylor(Prefers Democratic Party)
17,195
Adams County
70.76%
Steve Hailey3,185
29.24%
Kenneth E. Caylor1,316
Asotin County
62.47%
Steve Hailey5,561
37.53%
Kenneth E. Caylor3,341
Franklin County
86.77%
Steve Hailey2,611
13.23%
Kenneth E. Caylor398
Garfield County
77.28%
Steve Hailey966
22.72%
Kenneth E. Caylor284
Spokane County
65.15%
Steve Hailey10,352
34.85%
Kenneth E. Caylor5,537
Whitman County
59.66%
Steve Hailey9,347
40.34%
Kenneth E. Caylor6,319


| Legislative District 9 - State Representative Pos. 1 | |||
| County | Candidate | Vote | Vote % |
|---|---|---|---|
| Adams | |||
(Prefers Democratic Party) | 1,316 | 29.24% | |
(Prefers G.O.P. Party) | 3,185 | 70.76% | |
| Total Votes | 4,501 | 100% | |
| Asotin | |||
(Prefers Democratic Party) | 3,341 | 37.53% | |
(Prefers G.O.P. Party) | 5,561 | 62.47% | |
| Total Votes | 8,902 | 100% | |
| Franklin | |||
(Prefers Democratic Party) | 398 | 13.23% | |
(Prefers G.O.P. Party) | 2,611 | 86.77% | |
| Total Votes | 3,009 | 100% | |
| Garfield | |||
(Prefers Democratic Party) | 284 | 22.72% | |
(Prefers G.O.P. Party) | 966 | 77.28% | |
| Total Votes | 1,250 | 100% | |
| Spokane | |||
(Prefers Democratic Party) | 5,537 | 34.85% | |
(Prefers G.O.P. Party) | 10,352 | 65.15% | |
| Total Votes | 15,889 | 100% | |
| Whitman | |||
(Prefers Democratic Party) | 6,319 | 40.34% | |
(Prefers G.O.P. Party) | 9,347 | 59.66% | |
| Total Votes | 15,666 | 100% | |