


August 19, 2008 Primary Results
State Treasurer - County Results
Last updated on 09/04/2008 6:59 PM
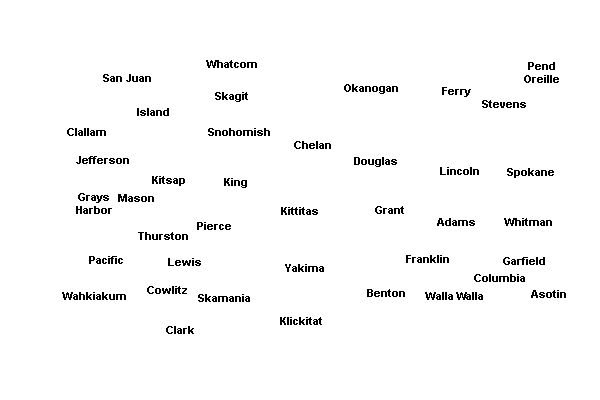
The boxes identify the two candidates receiving the most votes. The map displays the top vote-getter by county, which may include candidates other than the two receiving the most votes overall.The two candidates receiving the most votes overall will appear in the General Election.
Total
45.33%
Allan Martin(Prefers Republican Party)
613,595
39.41%
Jim McIntire(Prefers Democratic Party)
533,443
Adams County
66.24%
Allan Martin1,656
26.96%
Jim McIntire674
Asotin County
50.99%
Allan Martin2,680
36.99%
Jim McIntire1,944
Benton County
61.75%
Allan Martin23,239
28.02%
Jim McIntire10,544
Chelan County
64.01%
Allan Martin10,849
26.88%
Jim McIntire4,556
Clallam County
49.59%
Allan Martin10,708
36.54%
Jim McIntire7,890
Clark County
49.35%
Allan Martin35,716
37.89%
Jim McIntire27,420
Columbia County
65.09%
Allan Martin923
25.67%
Jim McIntire364
Cowlitz County
43.67%
Allan Martin9,332
43.33%
Jim McIntire9,260
Douglas County
63.86%
Allan Martin5,307
28.32%
Jim McIntire2,353
Ferry County
58.71%
Allan Martin1,139
29.48%
Jim McIntire572
Franklin County
61.98%
Allan Martin6,729
29.04%
Jim McIntire3,153
Garfield County
66.53%
Allan Martin495
27.28%
Jim McIntire203
Grant County
62.64%
Allan Martin9,126
29.92%
Jim McIntire4,360
Grays Harbor County
44.8%
Jim McIntire7,531
38.39%
Allan Martin6,453
Island County
48.24%
Allan Martin11,480
37.48%
Jim McIntire8,921
Jefferson County
46.31%
Jim McIntire5,807
36.77%
Allan Martin4,611
King County
46.48%
Jim McIntire156,248
36.21%
Allan Martin121,741
Kitsap County
45.44%
Allan Martin29,170
41.14%
Jim McIntire26,406
Kittitas County
54.77%
Allan Martin5,204
32.86%
Jim McIntire3,122
Klickitat County
51.25%
Allan Martin2,600
38.79%
Jim McIntire1,968
Lewis County
58.95%
Allan Martin11,081
30.14%
Jim McIntire5,665
Lincoln County
63.22%
Allan Martin2,350
29.06%
Jim McIntire1,080
Mason County
44.94%
Allan Martin7,449
40.37%
Jim McIntire6,692
Okanogan County
57.35%
Allan Martin4,867
31.49%
Jim McIntire2,672
Pacific County
40.75%
Jim McIntire2,699
37.49%
Allan Martin2,483
Pend Oreille County
54.99%
Allan Martin2,048
35.66%
Jim McIntire1,328
Pierce County
43.9%
Allan Martin63,330
38.88%
Jim McIntire56,085
San Juan County
45.66%
Jim McIntire2,958
36.91%
Allan Martin2,391
Skagit County
47.22%
Allan Martin13,887
39.74%
Jim McIntire11,687
Skamania County
47.99%
Allan Martin1,155
38.97%
Jim McIntire938
Snohomish County
44.13%
Allan Martin61,841
40.94%
Jim McIntire57,366
Spokane County
50.21%
Allan Martin52,320
36.52%
Jim McIntire38,057
Stevens County
60.55%
Allan Martin7,343
29.35%
Jim McIntire3,560
Thurston County
39.22%
Allan Martin24,870
33.41%
Jim McIntire21,188
Wahkiakum County
48.08%
Allan Martin639
34.24%
Jim McIntire455
Walla Walla County
58.66%
Allan Martin7,716
30.08%
Jim McIntire3,957
Whatcom County
45.58%
Allan Martin21,217
39.54%
Jim McIntire18,405
Whitman County
54.25%
Allan Martin4,295
32.1%
Jim McIntire2,541
Yakima County
57.04%
Allan Martin23,155
31.57%
Jim McIntire12,814


| State Treasurer | |||
| County | Candidate | Vote | Vote % |
|---|---|---|---|
| Adams | |||
(Prefers Republican Party) | 1,656 | 66.24% | |
(Prefers Democratic Party) | 170 | 6.8% | |
(Prefers Democratic Party) | 674 | 26.96% | |
| Total Votes | 2,500 | 100% | |
| Asotin | |||
(Prefers Republican Party) | 2,680 | 50.99% | |
(Prefers Democratic Party) | 632 | 12.02% | |
(Prefers Democratic Party) | 1,944 | 36.99% | |
| Total Votes | 5,256 | 100% | |
| Benton | |||
(Prefers Republican Party) | 23,239 | 61.75% | |
(Prefers Democratic Party) | 3,852 | 10.24% | |
(Prefers Democratic Party) | 10,544 | 28.02% | |
| Total Votes | 37,635 | 100% | |
| Chelan | |||
(Prefers Republican Party) | 10,849 | 64.01% | |
(Prefers Democratic Party) | 1,543 | 9.1% | |
(Prefers Democratic Party) | 4,556 | 26.88% | |
| Total Votes | 16,948 | 100% | |
| Clallam | |||
(Prefers Republican Party) | 10,708 | 49.59% | |
(Prefers Democratic Party) | 2,993 | 13.86% | |
(Prefers Democratic Party) | 7,890 | 36.54% | |
| Total Votes | 21,591 | 100% | |
| Clark | |||
(Prefers Republican Party) | 35,716 | 49.35% | |
(Prefers Democratic Party) | 9,231 | 12.76% | |
(Prefers Democratic Party) | 27,420 | 37.89% | |
| Total Votes | 72,367 | 100% | |
| Columbia | |||
(Prefers Republican Party) | 923 | 65.09% | |
(Prefers Democratic Party) | 131 | 9.24% | |
(Prefers Democratic Party) | 364 | 25.67% | |
| Total Votes | 1,418 | 100% | |
| Cowlitz | |||
(Prefers Republican Party) | 9,332 | 43.67% | |
(Prefers Democratic Party) | 2,778 | 13% | |
(Prefers Democratic Party) | 9,260 | 43.33% | |
| Total Votes | 21,370 | 100% | |
| Douglas | |||
(Prefers Republican Party) | 5,307 | 63.86% | |
(Prefers Democratic Party) | 650 | 7.82% | |
(Prefers Democratic Party) | 2,353 | 28.32% | |
| Total Votes | 8,310 | 100% | |
| Ferry | |||
(Prefers Republican Party) | 1,139 | 58.71% | |
(Prefers Democratic Party) | 229 | 11.8% | |
(Prefers Democratic Party) | 572 | 29.48% | |
| Total Votes | 1,940 | 100% | |
| Franklin | |||
(Prefers Republican Party) | 6,729 | 61.98% | |
(Prefers Democratic Party) | 974 | 8.97% | |
(Prefers Democratic Party) | 3,153 | 29.04% | |
| Total Votes | 10,856 | 100% | |
| Garfield | |||
(Prefers Republican Party) | 495 | 66.53% | |
(Prefers Democratic Party) | 46 | 6.18% | |
(Prefers Democratic Party) | 203 | 27.28% | |
| Total Votes | 744 | 100% | |
| Grant | |||
(Prefers Republican Party) | 9,126 | 62.64% | |
(Prefers Democratic Party) | 1,084 | 7.44% | |
(Prefers Democratic Party) | 4,360 | 29.92% | |
| Total Votes | 14,570 | 100% | |
| Grays Harbor | |||
(Prefers Republican Party) | 6,453 | 38.39% | |
(Prefers Democratic Party) | 2,827 | 16.82% | |
(Prefers Democratic Party) | 7,531 | 44.8% | |
| Total Votes | 16,811 | 100% | |
| Island | |||
(Prefers Republican Party) | 11,480 | 48.24% | |
(Prefers Democratic Party) | 3,398 | 14.28% | |
(Prefers Democratic Party) | 8,921 | 37.48% | |
| Total Votes | 23,799 | 100% | |
| Jefferson | |||
(Prefers Republican Party) | 4,611 | 36.77% | |
(Prefers Democratic Party) | 2,121 | 16.92% | |
(Prefers Democratic Party) | 5,807 | 46.31% | |
| Total Votes | 12,539 | 100% | |
| King | |||
(Prefers Republican Party) | 121,741 | 36.21% | |
(Prefers Democratic Party) | 58,207 | 17.31% | |
(Prefers Democratic Party) | 156,248 | 46.48% | |
| Total Votes | 336,196 | 100% | |
| Kitsap | |||
(Prefers Republican Party) | 29,170 | 45.44% | |
(Prefers Democratic Party) | 8,617 | 13.42% | |
(Prefers Democratic Party) | 26,406 | 41.14% | |
| Total Votes | 64,193 | 100% | |
| Kittitas | |||
(Prefers Republican Party) | 5,204 | 54.77% | |
(Prefers Democratic Party) | 1,175 | 12.37% | |
(Prefers Democratic Party) | 3,122 | 32.86% | |
| Total Votes | 9,501 | 100% | |
| Klickitat | |||
(Prefers Republican Party) | 2,600 | 51.25% | |
(Prefers Democratic Party) | 505 | 9.95% | |
(Prefers Democratic Party) | 1,968 | 38.79% | |
| Total Votes | 5,073 | 100% | |
| Lewis | |||
(Prefers Republican Party) | 11,081 | 58.95% | |
(Prefers Democratic Party) | 2,050 | 10.91% | |
(Prefers Democratic Party) | 5,665 | 30.14% | |
| Total Votes | 18,796 | 100% | |
| Lincoln | |||
(Prefers Republican Party) | 2,350 | 63.22% | |
(Prefers Democratic Party) | 287 | 7.72% | |
(Prefers Democratic Party) | 1,080 | 29.06% | |
| Total Votes | 3,717 | 100% | |
| Mason | |||
(Prefers Republican Party) | 7,449 | 44.94% | |
(Prefers Democratic Party) | 2,434 | 14.68% | |
(Prefers Democratic Party) | 6,692 | 40.37% | |
| Total Votes | 16,575 | 100% | |
| Okanogan | |||
(Prefers Republican Party) | 4,867 | 57.35% | |
(Prefers Democratic Party) | 947 | 11.16% | |
(Prefers Democratic Party) | 2,672 | 31.49% | |
| Total Votes | 8,486 | 100% | |
| Pacific | |||
(Prefers Republican Party) | 2,483 | 37.49% | |
(Prefers Democratic Party) | 1,441 | 21.76% | |
(Prefers Democratic Party) | 2,699 | 40.75% | |
| Total Votes | 6,623 | 100% | |
| Pend Oreille | |||
(Prefers Republican Party) | 2,048 | 54.99% | |
(Prefers Democratic Party) | 348 | 9.34% | |
(Prefers Democratic Party) | 1,328 | 35.66% | |
| Total Votes | 3,724 | 100% | |
| Pierce | |||
(Prefers Republican Party) | 63,330 | 43.9% | |
(Prefers Democratic Party) | 24,832 | 17.21% | |
(Prefers Democratic Party) | 56,085 | 38.88% | |
| Total Votes | 144,247 | 100% | |
| San Juan | |||
(Prefers Republican Party) | 2,391 | 36.91% | |
(Prefers Democratic Party) | 1,129 | 17.43% | |
(Prefers Democratic Party) | 2,958 | 45.66% | |
| Total Votes | 6,478 | 100% | |
| Skagit | |||
(Prefers Republican Party) | 13,887 | 47.22% | |
(Prefers Democratic Party) | 3,833 | 13.03% | |
(Prefers Democratic Party) | 11,687 | 39.74% | |
| Total Votes | 29,407 | 100% | |
| Skamania | |||
(Prefers Republican Party) | 1,155 | 47.99% | |
(Prefers Democratic Party) | 314 | 13.05% | |
(Prefers Democratic Party) | 938 | 38.97% | |
| Total Votes | 2,407 | 100% | |
| Snohomish | |||
(Prefers Republican Party) | 61,841 | 44.13% | |
(Prefers Democratic Party) | 20,919 | 14.93% | |
(Prefers Democratic Party) | 57,366 | 40.94% | |
| Total Votes | 140,126 | 100% | |
| Spokane | |||
(Prefers Republican Party) | 52,320 | 50.21% | |
(Prefers Democratic Party) | 13,826 | 13.27% | |
(Prefers Democratic Party) | 38,057 | 36.52% | |
| Total Votes | 104,203 | 100% | |
| Stevens | |||
(Prefers Republican Party) | 7,343 | 60.55% | |
(Prefers Democratic Party) | 1,225 | 10.1% | |
(Prefers Democratic Party) | 3,560 | 29.35% | |
| Total Votes | 12,128 | 100% | |
| Thurston | |||
(Prefers Republican Party) | 24,870 | 39.22% | |
(Prefers Democratic Party) | 17,360 | 27.37% | |
(Prefers Democratic Party) | 21,188 | 33.41% | |
| Total Votes | 63,418 | 100% | |
| Wahkiakum | |||
(Prefers Republican Party) | 639 | 48.08% | |
(Prefers Democratic Party) | 235 | 17.68% | |
(Prefers Democratic Party) | 455 | 34.24% | |
| Total Votes | 1,329 | 100% | |
| Walla Walla | |||
(Prefers Republican Party) | 7,716 | 58.66% | |
(Prefers Democratic Party) | 1,481 | 11.26% | |
(Prefers Democratic Party) | 3,957 | 30.08% | |
| Total Votes | 13,154 | 100% | |
| Whatcom | |||
(Prefers Republican Party) | 21,217 | 45.58% | |
(Prefers Democratic Party) | 6,929 | 14.88% | |
(Prefers Democratic Party) | 18,405 | 39.54% | |
| Total Votes | 46,551 | 100% | |
| Whitman | |||
(Prefers Republican Party) | 4,295 | 54.25% | |
(Prefers Democratic Party) | 1,081 | 13.65% | |
(Prefers Democratic Party) | 2,541 | 32.1% | |
| Total Votes | 7,917 | 100% | |
| Yakima | |||
(Prefers Republican Party) | 23,155 | 57.04% | |
(Prefers Democratic Party) | 4,623 | 11.39% | |
(Prefers Democratic Party) | 12,814 | 31.57% | |
| Total Votes | 40,592 | 100% | |