


August 19, 2008 Primary Results
Secretary of State - County Results
Last updated on 09/04/2008 6:59 PM
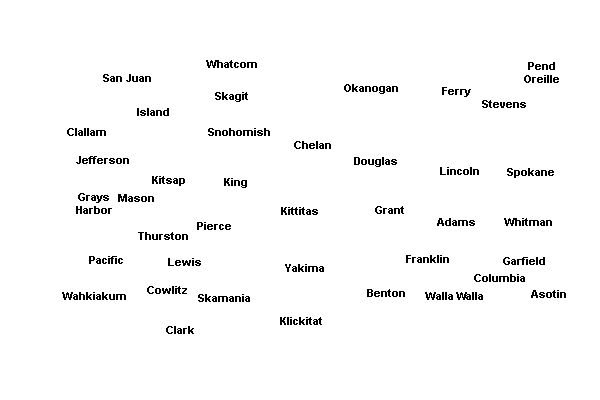
The boxes identify the two candidates receiving the most votes. The map displays the top vote-getter by county, which may include candidates other than the two receiving the most votes overall.The two candidates receiving the most votes overall will appear in the General Election.
Total
59.4%
Sam Reed(Prefers Republican Party)
816,171
32.48%
Jason Osgood(Prefers Democratic Party)
446,222
Adams County
72.84%
Sam Reed1,896
17.02%
Jason Osgood443
Asotin County
56.86%
Sam Reed2,999
31.76%
Jason Osgood1,675
Benton County
69.16%
Sam Reed26,562
21.67%
Jason Osgood8,322
Chelan County
68.35%
Sam Reed11,623
23.09%
Jason Osgood3,926
Clallam County
59.69%
Sam Reed13,117
32.15%
Jason Osgood7,066
Clark County
57.14%
Sam Reed41,605
33.74%
Jason Osgood24,568
Columbia County
69.23%
Sam Reed1,008
19.92%
Jason Osgood290
Cowlitz County
52.35%
Sam Reed11,347
37.63%
Jason Osgood8,156
Douglas County
69.27%
Sam Reed5,862
21.98%
Jason Osgood1,860
Ferry County
60.16%
Sam Reed1,205
26.96%
Jason Osgood540
Franklin County
67.21%
Sam Reed7,373
22.94%
Jason Osgood2,517
Garfield County
70.53%
Sam Reed536
18.95%
Jason Osgood144
Grant County
65.05%
Sam Reed9,661
23.32%
Jason Osgood3,464
Grays Harbor County
56.71%
Sam Reed9,713
35.04%
Jason Osgood6,002
Island County
60.78%
Sam Reed14,657
31.36%
Jason Osgood7,562
Jefferson County
48.71%
Sam Reed6,185
43.32%
Jason Osgood5,501
King County
56.58%
Sam Reed193,398
37.53%
Jason Osgood128,284
Kitsap County
58.64%
Sam Reed38,168
33.4%
Jason Osgood21,738
Kittitas County
64.73%
Sam Reed6,278
25.79%
Jason Osgood2,501
Klickitat County
54.53%
Sam Reed2,816
34.95%
Jason Osgood1,805
Lewis County
66.57%
Sam Reed12,803
22.2%
Jason Osgood4,270
Lincoln County
70.66%
Sam Reed2,693
18.68%
Jason Osgood712
Mason County
60.76%
Sam Reed10,282
30.69%
Jason Osgood5,193
Okanogan County
61.9%
Sam Reed5,352
27.2%
Jason Osgood2,352
Pacific County
51.47%
Sam Reed3,429
39.13%
Jason Osgood2,607
Pend Oreille County
58.22%
Sam Reed2,202
27.13%
Jason Osgood1,026
Pierce County
59.92%
Sam Reed87,434
32.25%
Jason Osgood47,057
San Juan County
49.93%
Sam Reed3,245
42.04%
Jason Osgood2,732
Skagit County
60.33%
Sam Reed17,924
31.37%
Jason Osgood9,320
Skamania County
53.19%
Sam Reed1,293
36.4%
Jason Osgood885
Snohomish County
57.13%
Sam Reed80,856
34.59%
Jason Osgood48,957
Spokane County
58.27%
Sam Reed62,025
30.55%
Jason Osgood32,514
Stevens County
61.64%
Sam Reed7,665
23.08%
Jason Osgood2,870
Thurston County
67.55%
Sam Reed43,830
25.71%
Jason Osgood16,679
Wahkiakum County
60.13%
Sam Reed822
30.94%
Jason Osgood423
Walla Walla County
67.05%
Sam Reed8,951
23.93%
Jason Osgood3,195
Whatcom County
57.59%
Sam Reed27,304
35.24%
Jason Osgood16,705
Whitman County
62.63%
Sam Reed5,091
29.14%
Jason Osgood2,369
Yakima County
66.09%
Sam Reed26,961
24.49%
Jason Osgood9,992


| Secretary of State | |||
| County | Candidate | Vote | Vote % |
|---|---|---|---|
| Adams | |||
(Prefers Democratic Party) | 443 | 17.02% | |
(Prefers Constitution Party) | 209 | 8.03% | |
(Prefers Party Of Commons Party) | 55 | 2.11% | |
(Prefers Republican Party) | 1,896 | 72.84% | |
| Total Votes | 2,603 | 100% | |
| Asotin | |||
(Prefers Democratic Party) | 1,675 | 31.76% | |
(Prefers Constitution Party) | 503 | 9.54% | |
(Prefers Party Of Commons Party) | 97 | 1.84% | |
(Prefers Republican Party) | 2,999 | 56.86% | |
| Total Votes | 5,274 | 100% | |
| Benton | |||
(Prefers Democratic Party) | 8,322 | 21.67% | |
(Prefers Constitution Party) | 3,004 | 7.82% | |
(Prefers Party Of Commons Party) | 518 | 1.35% | |
(Prefers Republican Party) | 26,562 | 69.16% | |
| Total Votes | 38,406 | 100% | |
| Chelan | |||
(Prefers Democratic Party) | 3,926 | 23.09% | |
(Prefers Constitution Party) | 1,194 | 7.02% | |
(Prefers Party Of Commons Party) | 263 | 1.55% | |
(Prefers Republican Party) | 11,623 | 68.35% | |
| Total Votes | 17,006 | 100% | |
| Clallam | |||
(Prefers Democratic Party) | 7,066 | 32.15% | |
(Prefers Constitution Party) | 1,454 | 6.62% | |
(Prefers Party Of Commons Party) | 339 | 1.54% | |
(Prefers Republican Party) | 13,117 | 59.69% | |
| Total Votes | 21,976 | 100% | |
| Clark | |||
(Prefers Democratic Party) | 24,568 | 33.74% | |
(Prefers Constitution Party) | 5,045 | 6.93% | |
(Prefers Party Of Commons Party) | 1,600 | 2.2% | |
(Prefers Republican Party) | 41,605 | 57.14% | |
| Total Votes | 72,818 | 100% | |
| Columbia | |||
(Prefers Democratic Party) | 290 | 19.92% | |
(Prefers Constitution Party) | 130 | 8.93% | |
(Prefers Party Of Commons Party) | 28 | 1.92% | |
(Prefers Republican Party) | 1,008 | 69.23% | |
| Total Votes | 1,456 | 100% | |
| Cowlitz | |||
(Prefers Democratic Party) | 8,156 | 37.63% | |
(Prefers Constitution Party) | 1,717 | 7.92% | |
(Prefers Party Of Commons Party) | 457 | 2.11% | |
(Prefers Republican Party) | 11,347 | 52.35% | |
| Total Votes | 21,677 | 100% | |
| Douglas | |||
(Prefers Democratic Party) | 1,860 | 21.98% | |
(Prefers Constitution Party) | 624 | 7.37% | |
(Prefers Party Of Commons Party) | 116 | 1.37% | |
(Prefers Republican Party) | 5,862 | 69.27% | |
| Total Votes | 8,462 | 100% | |
| Ferry | |||
(Prefers Democratic Party) | 540 | 26.96% | |
(Prefers Constitution Party) | 228 | 11.38% | |
(Prefers Party Of Commons Party) | 30 | 1.5% | |
(Prefers Republican Party) | 1,205 | 60.16% | |
| Total Votes | 2,003 | 100% | |
| Franklin | |||
(Prefers Democratic Party) | 2,517 | 22.94% | |
(Prefers Constitution Party) | 895 | 8.16% | |
(Prefers Party Of Commons Party) | 185 | 1.69% | |
(Prefers Republican Party) | 7,373 | 67.21% | |
| Total Votes | 10,970 | 100% | |
| Garfield | |||
(Prefers Democratic Party) | 144 | 18.95% | |
(Prefers Constitution Party) | 71 | 9.34% | |
(Prefers Party Of Commons Party) | 9 | 1.18% | |
(Prefers Republican Party) | 536 | 70.53% | |
| Total Votes | 760 | 100% | |
| Grant | |||
(Prefers Democratic Party) | 3,464 | 23.32% | |
(Prefers Constitution Party) | 1,477 | 9.94% | |
(Prefers Party Of Commons Party) | 250 | 1.68% | |
(Prefers Republican Party) | 9,661 | 65.05% | |
| Total Votes | 14,852 | 100% | |
| Grays Harbor | |||
(Prefers Democratic Party) | 6,002 | 35.04% | |
(Prefers Constitution Party) | 1,142 | 6.67% | |
(Prefers Party Of Commons Party) | 272 | 1.59% | |
(Prefers Republican Party) | 9,713 | 56.71% | |
| Total Votes | 17,129 | 100% | |
| Island | |||
(Prefers Democratic Party) | 7,562 | 31.36% | |
(Prefers Constitution Party) | 1,493 | 6.19% | |
(Prefers Party Of Commons Party) | 402 | 1.67% | |
(Prefers Republican Party) | 14,657 | 60.78% | |
| Total Votes | 24,114 | 100% | |
| Jefferson | |||
(Prefers Democratic Party) | 5,501 | 43.32% | |
(Prefers Constitution Party) | 775 | 6.1% | |
(Prefers Party Of Commons Party) | 237 | 1.87% | |
(Prefers Republican Party) | 6,185 | 48.71% | |
| Total Votes | 12,698 | 100% | |
| King | |||
(Prefers Democratic Party) | 128,284 | 37.53% | |
(Prefers Constitution Party) | 15,626 | 4.57% | |
(Prefers Party Of Commons Party) | 4,501 | 1.32% | |
(Prefers Republican Party) | 193,398 | 56.58% | |
| Total Votes | 341,809 | 100% | |
| Kitsap | |||
(Prefers Democratic Party) | 21,738 | 33.4% | |
(Prefers Constitution Party) | 4,022 | 6.18% | |
(Prefers Party Of Commons Party) | 1,156 | 1.78% | |
(Prefers Republican Party) | 38,168 | 58.64% | |
| Total Votes | 65,084 | 100% | |
| Kittitas | |||
(Prefers Democratic Party) | 2,501 | 25.79% | |
(Prefers Constitution Party) | 713 | 7.35% | |
(Prefers Party Of Commons Party) | 207 | 2.13% | |
(Prefers Republican Party) | 6,278 | 64.73% | |
| Total Votes | 9,699 | 100% | |
| Klickitat | |||
(Prefers Democratic Party) | 1,805 | 34.95% | |
(Prefers Constitution Party) | 452 | 8.75% | |
(Prefers Party Of Commons Party) | 91 | 1.76% | |
(Prefers Republican Party) | 2,816 | 54.53% | |
| Total Votes | 5,164 | 100% | |
| Lewis | |||
(Prefers Democratic Party) | 4,270 | 22.2% | |
(Prefers Constitution Party) | 1,764 | 9.17% | |
(Prefers Party Of Commons Party) | 396 | 2.06% | |
(Prefers Republican Party) | 12,803 | 66.57% | |
| Total Votes | 19,233 | 100% | |
| Lincoln | |||
(Prefers Democratic Party) | 712 | 18.68% | |
(Prefers Constitution Party) | 346 | 9.08% | |
(Prefers Party Of Commons Party) | 60 | 1.57% | |
(Prefers Republican Party) | 2,693 | 70.66% | |
| Total Votes | 3,811 | 100% | |
| Mason | |||
(Prefers Democratic Party) | 5,193 | 30.69% | |
(Prefers Constitution Party) | 1,117 | 6.6% | |
(Prefers Party Of Commons Party) | 330 | 1.95% | |
(Prefers Republican Party) | 10,282 | 60.76% | |
| Total Votes | 16,922 | 100% | |
| Okanogan | |||
(Prefers Democratic Party) | 2,352 | 27.2% | |
(Prefers Constitution Party) | 793 | 9.17% | |
(Prefers Party Of Commons Party) | 149 | 1.72% | |
(Prefers Republican Party) | 5,352 | 61.9% | |
| Total Votes | 8,646 | 100% | |
| Pacific | |||
(Prefers Democratic Party) | 2,607 | 39.13% | |
(Prefers Constitution Party) | 485 | 7.28% | |
(Prefers Party Of Commons Party) | 141 | 2.12% | |
(Prefers Republican Party) | 3,429 | 51.47% | |
| Total Votes | 6,662 | 100% | |
| Pend Oreille | |||
(Prefers Democratic Party) | 1,026 | 27.13% | |
(Prefers Constitution Party) | 486 | 12.85% | |
(Prefers Party Of Commons Party) | 68 | 1.8% | |
(Prefers Republican Party) | 2,202 | 58.22% | |
| Total Votes | 3,782 | 100% | |
| Pierce | |||
(Prefers Democratic Party) | 47,057 | 32.25% | |
(Prefers Constitution Party) | 9,043 | 6.2% | |
(Prefers Party Of Commons Party) | 2,394 | 1.64% | |
(Prefers Republican Party) | 87,434 | 59.92% | |
| Total Votes | 145,928 | 100% | |
| San Juan | |||
(Prefers Democratic Party) | 2,732 | 42.04% | |
(Prefers Constitution Party) | 413 | 6.35% | |
(Prefers Party Of Commons Party) | 109 | 1.68% | |
(Prefers Republican Party) | 3,245 | 49.93% | |
| Total Votes | 6,499 | 100% | |
| Skagit | |||
(Prefers Democratic Party) | 9,320 | 31.37% | |
(Prefers Constitution Party) | 1,978 | 6.66% | |
(Prefers Party Of Commons Party) | 486 | 1.64% | |
(Prefers Republican Party) | 17,924 | 60.33% | |
| Total Votes | 29,708 | 100% | |
| Skamania | |||
(Prefers Democratic Party) | 885 | 36.4% | |
(Prefers Constitution Party) | 197 | 8.1% | |
(Prefers Party Of Commons Party) | 56 | 2.3% | |
(Prefers Republican Party) | 1,293 | 53.19% | |
| Total Votes | 2,431 | 100% | |
| Snohomish | |||
(Prefers Democratic Party) | 48,957 | 34.59% | |
(Prefers Constitution Party) | 8,966 | 6.34% | |
(Prefers Party Of Commons Party) | 2,749 | 1.94% | |
(Prefers Republican Party) | 80,856 | 57.13% | |
| Total Votes | 141,528 | 100% | |
| Spokane | |||
(Prefers Democratic Party) | 32,514 | 30.55% | |
(Prefers Constitution Party) | 10,014 | 9.41% | |
(Prefers Party Of Commons Party) | 1,886 | 1.77% | |
(Prefers Republican Party) | 62,025 | 58.27% | |
| Total Votes | 106,439 | 100% | |
| Stevens | |||
(Prefers Democratic Party) | 2,870 | 23.08% | |
(Prefers Constitution Party) | 1,634 | 13.14% | |
(Prefers Party Of Commons Party) | 266 | 2.14% | |
(Prefers Republican Party) | 7,665 | 61.64% | |
| Total Votes | 12,435 | 100% | |
| Thurston | |||
(Prefers Democratic Party) | 16,679 | 25.71% | |
(Prefers Constitution Party) | 3,392 | 5.23% | |
(Prefers Party Of Commons Party) | 985 | 1.52% | |
(Prefers Republican Party) | 43,830 | 67.55% | |
| Total Votes | 64,886 | 100% | |
| Wahkiakum | |||
(Prefers Democratic Party) | 423 | 30.94% | |
(Prefers Constitution Party) | 95 | 6.95% | |
(Prefers Party Of Commons Party) | 27 | 1.98% | |
(Prefers Republican Party) | 822 | 60.13% | |
| Total Votes | 1,367 | 100% | |
| Walla Walla | |||
(Prefers Democratic Party) | 3,195 | 23.93% | |
(Prefers Constitution Party) | 999 | 7.48% | |
(Prefers Party Of Commons Party) | 205 | 1.54% | |
(Prefers Republican Party) | 8,951 | 67.05% | |
| Total Votes | 13,350 | 100% | |
| Whatcom | |||
(Prefers Democratic Party) | 16,705 | 35.24% | |
(Prefers Constitution Party) | 2,599 | 5.48% | |
(Prefers Party Of Commons Party) | 801 | 1.69% | |
(Prefers Republican Party) | 27,304 | 57.59% | |
| Total Votes | 47,409 | 100% | |
| Whitman | |||
(Prefers Democratic Party) | 2,369 | 29.14% | |
(Prefers Constitution Party) | 543 | 6.68% | |
(Prefers Party Of Commons Party) | 126 | 1.55% | |
(Prefers Republican Party) | 5,091 | 62.63% | |
| Total Votes | 8,129 | 100% | |
| Yakima | |||
(Prefers Democratic Party) | 9,992 | 24.49% | |
(Prefers Constitution Party) | 3,090 | 7.57% | |
(Prefers Party Of Commons Party) | 753 | 1.85% | |
(Prefers Republican Party) | 26,961 | 66.09% | |
| Total Votes | 40,796 | 100% | |