


August 19, 2008 Primary Results
Lt. Governor - County Results
Last updated on 09/04/2008 6:59 PM
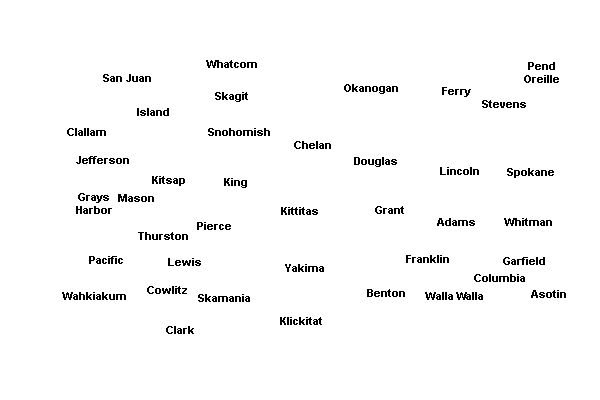
The boxes identify the two candidates receiving the most votes. The map displays the top vote-getter by county, which may include candidates other than the two receiving the most votes overall.The two candidates receiving the most votes overall will appear in the General Election.
Total
52.08%
Brad Owen(Prefers Democratic Party)
706,641
25.62%
Marcia McCraw(Prefers Republican Party)
347,551
Adams County
35.23%
Brad Owen898
34.17%
Marcia McCraw871
Asotin County
41.37%
Brad Owen2,166
28.42%
Marcia McCraw1,488
Benton County
37.5%
Brad Owen14,254
37.34%
Marcia McCraw14,193
Chelan County
37.98%
Brad Owen6,295
36.93%
Marcia McCraw6,121
Clallam County
52.14%
Brad Owen11,513
26.69%
Marcia McCraw5,894
Clark County
47.71%
Brad Owen34,528
25.83%
Marcia McCraw18,695
Columbia County
37.59%
Brad Owen530
33.62%
Marcia McCraw474
Cowlitz County
48.97%
Brad Owen10,486
22.09%
Marcia McCraw4,731
Douglas County
37.7%
Brad Owen3,123
36.56%
Marcia McCraw3,028
Ferry County
37.52%
Brad Owen735
30.02%
Marcia McCraw588
Franklin County
37.08%
Marcia McCraw4,004
36.92%
Brad Owen3,987
Garfield County
39.01%
Brad Owen293
27.83%
Jim Wiest209
Grant County
35.06%
Marcia McCraw5,162
34.61%
Brad Owen5,096
Grays Harbor County
63.85%
Brad Owen11,047
17.51%
Marcia McCraw3,030
Island County
49.83%
Brad Owen11,890
29.82%
Marcia McCraw7,115
Jefferson County
61.58%
Brad Owen7,795
20.07%
Marcia McCraw2,541
King County
59.84%
Brad Owen200,390
21.64%
Marcia McCraw72,470
Kitsap County
54.85%
Brad Owen35,532
25.07%
Marcia McCraw16,237
Kittitas County
46.43%
Brad Owen4,455
30.64%
Marcia McCraw2,940
Klickitat County
44.26%
Brad Owen2,246
27.63%
Marcia McCraw1,402
Lewis County
41.28%
Brad Owen7,812
27.61%
Marcia McCraw5,225
Lincoln County
41.22%
Brad Owen1,536
29.01%
Marcia McCraw1,081
Mason County
61.4%
Brad Owen10,524
20.03%
Marcia McCraw3,433
Okanogan County
38.17%
Brad Owen3,236
26.83%
Marcia McCraw2,274
Pacific County
56.9%
Brad Owen3,796
21.38%
Marcia McCraw1,426
Pend Oreille County
38.91%
Brad Owen1,457
27.16%
Marcia McCraw1,017
Pierce County
51.57%
Brad Owen74,626
27.13%
Marcia McCraw39,266
San Juan County
59.41%
Brad Owen3,812
24.21%
Marcia McCraw1,553
Skagit County
50.41%
Brad Owen14,877
27.63%
Marcia McCraw8,156
Skamania County
48.06%
Brad Owen1,165
25.33%
Marcia McCraw614
Snohomish County
52.35%
Brad Owen73,200
27.4%
Marcia McCraw38,307
Spokane County
46.09%
Brad Owen48,635
25.43%
Marcia McCraw26,837
Stevens County
34.19%
Brad Owen4,192
29.6%
Marcia McCraw3,630
Thurston County
61.1%
Brad Owen39,128
18.22%
Marcia McCraw11,668
Wahkiakum County
49.37%
Brad Owen669
25.31%
Marcia McCraw343
Walla Walla County
41.9%
Brad Owen5,523
30.73%
Marcia McCraw4,051
Whatcom County
52.23%
Brad Owen24,209
27.17%
Marcia McCraw12,594
Whitman County
45.81%
Brad Owen3,631
25.92%
Marcia McCraw2,055
Yakima County
43.13%
Brad Owen17,354
31.89%
Marcia McCraw12,833


| Lt. Governor | |||
| County | Candidate | Vote | Vote % |
|---|---|---|---|
| Adams | |||
(Prefers Constitution Party) | 125 | 4.9% | |
(Prefers Democratic Party) | 898 | 35.23% | |
(Prefers G.O.P. Party) | 585 | 22.95% | |
(Prefers Republican Party) | 871 | 34.17% | |
(Prefers Democratic Party) | 70 | 2.75% | |
| Total Votes | 2,549 | 100% | |
| Asotin | |||
(Prefers Constitution Party) | 270 | 5.16% | |
(Prefers Democratic Party) | 2,166 | 41.37% | |
(Prefers G.O.P. Party) | 984 | 18.79% | |
(Prefers Republican Party) | 1,488 | 28.42% | |
(Prefers Democratic Party) | 328 | 6.26% | |
| Total Votes | 5,236 | 100% | |
| Benton | |||
(Prefers Constitution Party) | 1,778 | 4.68% | |
(Prefers Democratic Party) | 14,254 | 37.5% | |
(Prefers G.O.P. Party) | 6,823 | 17.95% | |
(Prefers Republican Party) | 14,193 | 37.34% | |
(Prefers Democratic Party) | 958 | 2.52% | |
| Total Votes | 38,006 | 100% | |
| Chelan | |||
(Prefers Constitution Party) | 677 | 4.08% | |
(Prefers Democratic Party) | 6,295 | 37.98% | |
(Prefers G.O.P. Party) | 2,950 | 17.8% | |
(Prefers Republican Party) | 6,121 | 36.93% | |
(Prefers Democratic Party) | 532 | 3.21% | |
| Total Votes | 16,575 | 100% | |
| Clallam | |||
(Prefers Constitution Party) | 757 | 3.43% | |
(Prefers Democratic Party) | 11,513 | 52.14% | |
(Prefers G.O.P. Party) | 3,169 | 14.35% | |
(Prefers Republican Party) | 5,894 | 26.69% | |
(Prefers Democratic Party) | 747 | 3.38% | |
| Total Votes | 22,080 | 100% | |
| Clark | |||
(Prefers Constitution Party) | 3,132 | 4.33% | |
(Prefers Democratic Party) | 34,528 | 47.71% | |
(Prefers G.O.P. Party) | 13,220 | 18.27% | |
(Prefers Republican Party) | 18,695 | 25.83% | |
(Prefers Democratic Party) | 2,794 | 3.86% | |
| Total Votes | 72,369 | 100% | |
| Columbia | |||
(Prefers Constitution Party) | 73 | 5.18% | |
(Prefers Democratic Party) | 530 | 37.59% | |
(Prefers G.O.P. Party) | 284 | 20.14% | |
(Prefers Republican Party) | 474 | 33.62% | |
(Prefers Democratic Party) | 49 | 3.48% | |
| Total Votes | 1,410 | 100% | |
| Cowlitz | |||
(Prefers Constitution Party) | 1,127 | 5.26% | |
(Prefers Democratic Party) | 10,486 | 48.97% | |
(Prefers G.O.P. Party) | 3,755 | 17.54% | |
(Prefers Republican Party) | 4,731 | 22.09% | |
(Prefers Democratic Party) | 1,314 | 6.14% | |
| Total Votes | 21,413 | 100% | |
| Douglas | |||
(Prefers Constitution Party) | 357 | 4.31% | |
(Prefers Democratic Party) | 3,123 | 37.7% | |
(Prefers G.O.P. Party) | 1,536 | 18.54% | |
(Prefers Republican Party) | 3,028 | 36.56% | |
(Prefers Democratic Party) | 239 | 2.89% | |
| Total Votes | 8,283 | 100% | |
| Ferry | |||
(Prefers Constitution Party) | 170 | 8.68% | |
(Prefers Democratic Party) | 735 | 37.52% | |
(Prefers G.O.P. Party) | 376 | 19.19% | |
(Prefers Republican Party) | 588 | 30.02% | |
(Prefers Democratic Party) | 90 | 4.59% | |
| Total Votes | 1,959 | 100% | |
| Franklin | |||
(Prefers Constitution Party) | 560 | 5.19% | |
(Prefers Democratic Party) | 3,987 | 36.92% | |
(Prefers G.O.P. Party) | 1,832 | 16.96% | |
(Prefers Republican Party) | 4,004 | 37.08% | |
(Prefers Democratic Party) | 416 | 3.85% | |
| Total Votes | 10,799 | 100% | |
| Garfield | |||
(Prefers Constitution Party) | 25 | 3.33% | |
(Prefers Democratic Party) | 293 | 39.01% | |
(Prefers G.O.P. Party) | 209 | 27.83% | |
(Prefers Republican Party) | 204 | 27.16% | |
(Prefers Democratic Party) | 20 | 2.66% | |
| Total Votes | 751 | 100% | |
| Grant | |||
(Prefers Constitution Party) | 862 | 5.85% | |
(Prefers Democratic Party) | 5,096 | 34.61% | |
(Prefers G.O.P. Party) | 3,016 | 20.48% | |
(Prefers Republican Party) | 5,162 | 35.06% | |
(Prefers Democratic Party) | 587 | 3.99% | |
| Total Votes | 14,723 | 100% | |
| Grays Harbor | |||
(Prefers Constitution Party) | 673 | 3.89% | |
(Prefers Democratic Party) | 11,047 | 63.85% | |
(Prefers G.O.P. Party) | 1,803 | 10.42% | |
(Prefers Republican Party) | 3,030 | 17.51% | |
(Prefers Democratic Party) | 749 | 4.33% | |
| Total Votes | 17,302 | 100% | |
| Island | |||
(Prefers Constitution Party) | 759 | 3.18% | |
(Prefers Democratic Party) | 11,890 | 49.83% | |
(Prefers G.O.P. Party) | 3,324 | 13.93% | |
(Prefers Republican Party) | 7,115 | 29.82% | |
(Prefers Democratic Party) | 771 | 3.23% | |
| Total Votes | 23,859 | 100% | |
| Jefferson | |||
(Prefers Constitution Party) | 359 | 2.84% | |
(Prefers Democratic Party) | 7,795 | 61.58% | |
(Prefers G.O.P. Party) | 1,374 | 10.85% | |
(Prefers Republican Party) | 2,541 | 20.07% | |
(Prefers Democratic Party) | 590 | 4.66% | |
| Total Votes | 12,659 | 100% | |
| King | |||
(Prefers Constitution Party) | 7,811 | 2.33% | |
(Prefers Democratic Party) | 200,390 | 59.84% | |
(Prefers G.O.P. Party) | 35,204 | 10.51% | |
(Prefers Republican Party) | 72,470 | 21.64% | |
(Prefers Democratic Party) | 18,980 | 5.67% | |
| Total Votes | 334,855 | 100% | |
| Kitsap | |||
(Prefers Constitution Party) | 2,055 | 3.17% | |
(Prefers Democratic Party) | 35,532 | 54.85% | |
(Prefers G.O.P. Party) | 8,579 | 13.24% | |
(Prefers Republican Party) | 16,237 | 25.07% | |
(Prefers Democratic Party) | 2,373 | 3.66% | |
| Total Votes | 64,776 | 100% | |
| Kittitas | |||
(Prefers Constitution Party) | 376 | 3.92% | |
(Prefers Democratic Party) | 4,455 | 46.43% | |
(Prefers G.O.P. Party) | 1,584 | 16.51% | |
(Prefers Republican Party) | 2,940 | 30.64% | |
(Prefers Democratic Party) | 241 | 2.51% | |
| Total Votes | 9,596 | 100% | |
| Klickitat | |||
(Prefers Constitution Party) | 281 | 5.54% | |
(Prefers Democratic Party) | 2,246 | 44.26% | |
(Prefers G.O.P. Party) | 851 | 16.77% | |
(Prefers Republican Party) | 1,402 | 27.63% | |
(Prefers Democratic Party) | 294 | 5.79% | |
| Total Votes | 5,074 | 100% | |
| Lewis | |||
(Prefers Constitution Party) | 931 | 4.92% | |
(Prefers Democratic Party) | 7,812 | 41.28% | |
(Prefers G.O.P. Party) | 4,295 | 22.7% | |
(Prefers Republican Party) | 5,225 | 27.61% | |
(Prefers Democratic Party) | 661 | 3.49% | |
| Total Votes | 18,924 | 100% | |
| Lincoln | |||
(Prefers Constitution Party) | 217 | 5.82% | |
(Prefers Democratic Party) | 1,536 | 41.22% | |
(Prefers G.O.P. Party) | 789 | 21.18% | |
(Prefers Republican Party) | 1,081 | 29.01% | |
(Prefers Democratic Party) | 103 | 2.76% | |
| Total Votes | 3,726 | 100% | |
| Mason | |||
(Prefers Constitution Party) | 571 | 3.33% | |
(Prefers Democratic Party) | 10,524 | 61.4% | |
(Prefers G.O.P. Party) | 1,844 | 10.76% | |
(Prefers Republican Party) | 3,433 | 20.03% | |
(Prefers Democratic Party) | 769 | 4.49% | |
| Total Votes | 17,141 | 100% | |
| Okanogan | |||
(Prefers Constitution Party) | 509 | 6% | |
(Prefers Democratic Party) | 3,236 | 38.17% | |
(Prefers G.O.P. Party) | 2,051 | 24.19% | |
(Prefers Republican Party) | 2,274 | 26.83% | |
(Prefers Democratic Party) | 407 | 4.8% | |
| Total Votes | 8,477 | 100% | |
| Pacific | |||
(Prefers Constitution Party) | 247 | 3.7% | |
(Prefers Democratic Party) | 3,796 | 56.9% | |
(Prefers G.O.P. Party) | 825 | 12.37% | |
(Prefers Republican Party) | 1,426 | 21.38% | |
(Prefers Democratic Party) | 377 | 5.65% | |
| Total Votes | 6,671 | 100% | |
| Pend Oreille | |||
(Prefers Constitution Party) | 303 | 8.09% | |
(Prefers Democratic Party) | 1,457 | 38.91% | |
(Prefers G.O.P. Party) | 811 | 21.66% | |
(Prefers Republican Party) | 1,017 | 27.16% | |
(Prefers Democratic Party) | 157 | 4.19% | |
| Total Votes | 3,745 | 100% | |
| Pierce | |||
(Prefers Constitution Party) | 4,781 | 3.3% | |
(Prefers Democratic Party) | 74,626 | 51.57% | |
(Prefers G.O.P. Party) | 18,844 | 13.02% | |
(Prefers Republican Party) | 39,266 | 27.13% | |
(Prefers Democratic Party) | 7,195 | 4.97% | |
| Total Votes | 144,712 | 100% | |
| San Juan | |||
(Prefers Constitution Party) | 167 | 2.6% | |
(Prefers Democratic Party) | 3,812 | 59.41% | |
(Prefers G.O.P. Party) | 607 | 9.46% | |
(Prefers Republican Party) | 1,553 | 24.21% | |
(Prefers Democratic Party) | 277 | 4.32% | |
| Total Votes | 6,416 | 100% | |
| Skagit | |||
(Prefers Constitution Party) | 947 | 3.21% | |
(Prefers Democratic Party) | 14,877 | 50.41% | |
(Prefers G.O.P. Party) | 4,476 | 15.17% | |
(Prefers Republican Party) | 8,156 | 27.63% | |
(Prefers Democratic Party) | 1,058 | 3.58% | |
| Total Votes | 29,514 | 100% | |
| Skamania | |||
(Prefers Constitution Party) | 155 | 6.39% | |
(Prefers Democratic Party) | 1,165 | 48.06% | |
(Prefers G.O.P. Party) | 382 | 15.76% | |
(Prefers Republican Party) | 614 | 25.33% | |
(Prefers Democratic Party) | 108 | 4.46% | |
| Total Votes | 2,424 | 100% | |
| Snohomish | |||
(Prefers Constitution Party) | 4,963 | 3.55% | |
(Prefers Democratic Party) | 73,200 | 52.35% | |
(Prefers G.O.P. Party) | 18,122 | 12.96% | |
(Prefers Republican Party) | 38,307 | 27.4% | |
(Prefers Democratic Party) | 5,237 | 3.75% | |
| Total Votes | 139,829 | 100% | |
| Spokane | |||
(Prefers Constitution Party) | 5,755 | 5.45% | |
(Prefers Democratic Party) | 48,635 | 46.09% | |
(Prefers G.O.P. Party) | 19,934 | 18.89% | |
(Prefers Republican Party) | 26,837 | 25.43% | |
(Prefers Democratic Party) | 4,353 | 4.13% | |
| Total Votes | 105,514 | 100% | |
| Stevens | |||
(Prefers Constitution Party) | 1,085 | 8.85% | |
(Prefers Democratic Party) | 4,192 | 34.19% | |
(Prefers G.O.P. Party) | 2,883 | 23.51% | |
(Prefers Republican Party) | 3,630 | 29.6% | |
(Prefers Democratic Party) | 472 | 3.85% | |
| Total Votes | 12,262 | 100% | |
| Thurston | |||
(Prefers Constitution Party) | 1,746 | 2.73% | |
(Prefers Democratic Party) | 39,128 | 61.1% | |
(Prefers G.O.P. Party) | 8,698 | 13.58% | |
(Prefers Republican Party) | 11,668 | 18.22% | |
(Prefers Democratic Party) | 2,803 | 4.38% | |
| Total Votes | 64,043 | 100% | |
| Wahkiakum | |||
(Prefers Constitution Party) | 72 | 5.31% | |
(Prefers Democratic Party) | 669 | 49.37% | |
(Prefers G.O.P. Party) | 218 | 16.09% | |
(Prefers Republican Party) | 343 | 25.31% | |
(Prefers Democratic Party) | 53 | 3.91% | |
| Total Votes | 1,355 | 100% | |
| Walla Walla | |||
(Prefers Constitution Party) | 516 | 3.91% | |
(Prefers Democratic Party) | 5,523 | 41.9% | |
(Prefers G.O.P. Party) | 2,608 | 19.79% | |
(Prefers Republican Party) | 4,051 | 30.73% | |
(Prefers Democratic Party) | 483 | 3.66% | |
| Total Votes | 13,181 | 100% | |
| Whatcom | |||
(Prefers Constitution Party) | 1,579 | 3.41% | |
(Prefers Democratic Party) | 24,209 | 52.23% | |
(Prefers G.O.P. Party) | 6,485 | 13.99% | |
(Prefers Republican Party) | 12,594 | 27.17% | |
(Prefers Democratic Party) | 1,483 | 3.2% | |
| Total Votes | 46,350 | 100% | |
| Whitman | |||
(Prefers Constitution Party) | 307 | 3.87% | |
(Prefers Democratic Party) | 3,631 | 45.81% | |
(Prefers G.O.P. Party) | 1,642 | 20.71% | |
(Prefers Republican Party) | 2,055 | 25.92% | |
(Prefers Democratic Party) | 292 | 3.68% | |
| Total Votes | 7,927 | 100% | |
| Yakima | |||
(Prefers Constitution Party) | 1,809 | 4.5% | |
(Prefers Democratic Party) | 17,354 | 43.13% | |
(Prefers G.O.P. Party) | 6,780 | 16.85% | |
(Prefers Republican Party) | 12,833 | 31.89% | |
(Prefers Democratic Party) | 1,460 | 3.63% | |
| Total Votes | 40,236 | 100% | |