


November 04, 2008 General Election Results
U.S. Congressional District 4 - Representative - County Results
Last updated on 11/26/2008 9:41 AM
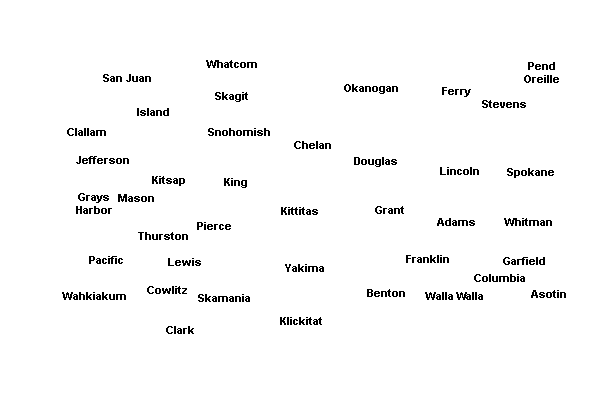
The boxes identify the two candidates receiving the most votes. The map displays the top vote-getter by county, which may include candidates other than the two receiving the most votes overall.
Total
63.09%
Doc Hastings(Prefers Republican Party)
169,940
36.91%
George Fearing(Prefers Democratic Party)
99,430
Adams County
67.08%
Doc Hastings1,522
32.92%
George Fearing747
Benton County
65.23%
Doc Hastings46,603
34.77%
George Fearing24,838
Chelan County
65.49%
Doc Hastings20,270
34.51%
George Fearing10,681
Douglas County
68.52%
Doc Hastings10,108
31.48%
George Fearing4,644
Franklin County
64.06%
Doc Hastings12,408
35.94%
George Fearing6,960
Grant County
69.17%
Doc Hastings18,460
30.83%
George Fearing8,227
Kittitas County
58.57%
Doc Hastings10,095
41.43%
George Fearing7,142
Klickitat County
57.25%
Doc Hastings5,603
42.75%
George Fearing4,184
Skamania County
52.11%
Doc Hastings717
47.89%
George Fearing659
Yakima County
58.48%
Doc Hastings44,154
41.52%
George Fearing31,348


| U.S. Congressional District 4 - Representative | |||
| County | Candidate | Vote | Vote % |
|---|---|---|---|
| Adams | |||
(Prefers Republican Party) | 1,522 | 67.08% | |
(Prefers Democratic Party) | 747 | 32.92% | |
| Total Votes | 2,269 | 100% | |
| Benton | |||
(Prefers Republican Party) | 46,603 | 65.23% | |
(Prefers Democratic Party) | 24,838 | 34.77% | |
| Total Votes | 71,441 | 100% | |
| Chelan | |||
(Prefers Republican Party) | 20,270 | 65.49% | |
(Prefers Democratic Party) | 10,681 | 34.51% | |
| Total Votes | 30,951 | 100% | |
| Douglas | |||
(Prefers Republican Party) | 10,108 | 68.52% | |
(Prefers Democratic Party) | 4,644 | 31.48% | |
| Total Votes | 14,752 | 100% | |
| Franklin | |||
(Prefers Republican Party) | 12,408 | 64.06% | |
(Prefers Democratic Party) | 6,960 | 35.94% | |
| Total Votes | 19,368 | 100% | |
| Grant | |||
(Prefers Republican Party) | 18,460 | 69.17% | |
(Prefers Democratic Party) | 8,227 | 30.83% | |
| Total Votes | 26,687 | 100% | |
| Kittitas | |||
(Prefers Republican Party) | 10,095 | 58.57% | |
(Prefers Democratic Party) | 7,142 | 41.43% | |
| Total Votes | 17,237 | 100% | |
| Klickitat | |||
(Prefers Republican Party) | 5,603 | 57.25% | |
(Prefers Democratic Party) | 4,184 | 42.75% | |
| Total Votes | 9,787 | 100% | |
| Skamania | |||
(Prefers Republican Party) | 717 | 52.11% | |
(Prefers Democratic Party) | 659 | 47.89% | |
| Total Votes | 1,376 | 100% | |
| Yakima | |||
(Prefers Republican Party) | 44,154 | 58.48% | |
(Prefers Democratic Party) | 31,348 | 41.52% | |
| Total Votes | 75,502 | 100% | |