


November 04, 2008 General Election Results
President/Vice President - County Results
Last updated on 11/26/2008 9:41 AM
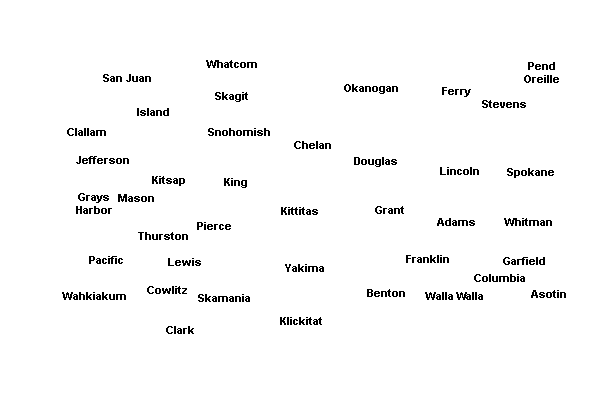
The boxes identify the two candidates receiving the most votes. The map displays the top vote-getter by county, which may include candidates other than the two receiving the most votes overall.
Total
57.65%
Barack Obama / Joe BidenDemocratic Party Nominees
1,750,848
40.48%
John McCain / Sarah PalinRepublican Party Nominees
1,229,216
Adams County
66.32%
John McCain / Sarah Palin3,222
31.95%
Barack Obama / Joe Biden1,552
Asotin County
55.74%
John McCain / Sarah Palin5,451
42.32%
Barack Obama / Joe Biden4,139
Benton County
62.19%
John McCain / Sarah Palin45,345
36.05%
Barack Obama / Joe Biden26,288
Chelan County
55.09%
John McCain / Sarah Palin17,605
43.12%
Barack Obama / Joe Biden13,781
Clallam County
50.55%
Barack Obama / Joe Biden19,470
47.25%
John McCain / Sarah Palin18,199
Clark County
52.17%
Barack Obama / Joe Biden95,356
46.08%
John McCain / Sarah Palin84,212
Columbia County
67.28%
John McCain / Sarah Palin1,499
30.79%
Barack Obama / Joe Biden686
Cowlitz County
54.38%
Barack Obama / Joe Biden24,597
43.23%
John McCain / Sarah Palin19,554
Douglas County
59.82%
John McCain / Sarah Palin9,098
38.45%
Barack Obama / Joe Biden5,848
Ferry County
54.73%
John McCain / Sarah Palin1,916
41.9%
Barack Obama / Joe Biden1,467
Franklin County
61.11%
John McCain / Sarah Palin12,037
37.37%
Barack Obama / Joe Biden7,361
Garfield County
70.5%
John McCain / Sarah Palin968
28.04%
Barack Obama / Joe Biden385
Grant County
62.52%
John McCain / Sarah Palin17,153
34.99%
Barack Obama / Joe Biden9,601
Grays Harbor County
56.04%
Barack Obama / Joe Biden16,354
41.47%
John McCain / Sarah Palin12,104
Island County
52.32%
Barack Obama / Joe Biden22,058
46.08%
John McCain / Sarah Palin19,426
Jefferson County
66.29%
Barack Obama / Joe Biden13,252
31.66%
John McCain / Sarah Palin6,330
King County
70.3%
Barack Obama / Joe Biden648,230
28.17%
John McCain / Sarah Palin259,716
Kitsap County
55.19%
Barack Obama / Joe Biden68,624
42.86%
John McCain / Sarah Palin53,297
Kittitas County
53.01%
John McCain / Sarah Palin9,471
44.94%
Barack Obama / Joe Biden8,030
Klickitat County
48.85%
Barack Obama / Joe Biden4,965
48.64%
John McCain / Sarah Palin4,944
Lewis County
58.43%
John McCain / Sarah Palin20,278
39.26%
Barack Obama / Joe Biden13,624
Lincoln County
63.63%
John McCain / Sarah Palin3,803
34%
Barack Obama / Joe Biden2,032
Mason County
53.17%
Barack Obama / Joe Biden15,050
44.51%
John McCain / Sarah Palin12,600
Okanogan County
52.15%
John McCain / Sarah Palin8,798
45.13%
Barack Obama / Joe Biden7,613
Pacific County
55.72%
Barack Obama / Joe Biden6,094
41.65%
John McCain / Sarah Palin4,555
Pend Oreille County
56.73%
John McCain / Sarah Palin3,717
39.1%
Barack Obama / Joe Biden2,562
Pierce County
55.18%
Barack Obama / Joe Biden181,824
42.99%
John McCain / Sarah Palin141,673
San Juan County
70.02%
Barack Obama / Joe Biden7,374
28.09%
John McCain / Sarah Palin2,958
Skagit County
53.78%
Barack Obama / Joe Biden30,053
44.17%
John McCain / Sarah Palin24,687
Skamania County
51.31%
Barack Obama / Joe Biden2,817
45.97%
John McCain / Sarah Palin2,524
Snohomish County
58.47%
Barack Obama / Joe Biden187,294
39.56%
John McCain / Sarah Palin126,722
Spokane County
49.34%
John McCain / Sarah Palin108,314
48.19%
Barack Obama / Joe Biden105,786
Stevens County
58.78%
John McCain / Sarah Palin13,132
38.04%
Barack Obama / Joe Biden8,499
Thurston County
59.89%
Barack Obama / Joe Biden75,882
38.17%
John McCain / Sarah Palin48,366
Wahkiakum County
48.87%
Barack Obama / Joe Biden1,121
48.17%
John McCain / Sarah Palin1,105
Walla Walla County
57.35%
John McCain / Sarah Palin14,182
40.77%
Barack Obama / Joe Biden10,081
Whatcom County
58.04%
Barack Obama / Joe Biden58,236
40.07%
John McCain / Sarah Palin40,205
Whitman County
51.57%
Barack Obama / Joe Biden9,070
46.07%
John McCain / Sarah Palin8,104
Yakima County
54.43%
John McCain / Sarah Palin41,946
43.85%
Barack Obama / Joe Biden33,792


| President/Vice President | |||
| County | Candidate | Vote | Vote % |
|---|---|---|---|
| Adams | |||
Democratic Party Nominees | 1,552 | 31.95% | |
Libertarian Party Nominees | 16 | 0.33% | |
Constitution Party Nominees | 18 | 0.37% | |
Green Party Nominees | 2 | 0.04% | |
Socialism & Liberation Party Nominees | 2 | 0.04% | |
Socialist Workers Party Nominees | 2 | 0.04% | |
Republican Party Nominees | 3,222 | 66.32% | |
Independent Candidates | 44 | 0.91% | |
| Total Votes | 4,858 | 100% | |
| Asotin | |||
Democratic Party Nominees | 4,139 | 42.32% | |
Libertarian Party Nominees | 19 | 0.19% | |
Constitution Party Nominees | 44 | 0.45% | |
Green Party Nominees | 8 | 0.08% | |
Socialism & Liberation Party Nominees | 0% | ||
Socialist Workers Party Nominees | 1 | 0.01% | |
Republican Party Nominees | 5,451 | 55.74% | |
Independent Candidates | 118 | 1.21% | |
| Total Votes | 9,780 | 100% | |
| Benton | |||
Democratic Party Nominees | 26,288 | 36.05% | |
Libertarian Party Nominees | 338 | 0.46% | |
Constitution Party Nominees | 247 | 0.34% | |
Green Party Nominees | 59 | 0.08% | |
Socialism & Liberation Party Nominees | 13 | 0.02% | |
Socialist Workers Party Nominees | 11 | 0.02% | |
Republican Party Nominees | 45,345 | 62.19% | |
Independent Candidates | 610 | 0.84% | |
| Total Votes | 72,911 | 100% | |
| Chelan | |||
Democratic Party Nominees | 13,781 | 43.12% | |
Libertarian Party Nominees | 98 | 0.31% | |
Constitution Party Nominees | 125 | 0.39% | |
Green Party Nominees | 29 | 0.09% | |
Socialism & Liberation Party Nominees | 5 | 0.02% | |
Socialist Workers Party Nominees | 7 | 0.02% | |
Republican Party Nominees | 17,605 | 55.09% | |
Independent Candidates | 308 | 0.96% | |
| Total Votes | 31,958 | 100% | |
| Clallam | |||
Democratic Party Nominees | 19,470 | 50.55% | |
Libertarian Party Nominees | 177 | 0.46% | |
Constitution Party Nominees | 116 | 0.3% | |
Green Party Nominees | 54 | 0.14% | |
Socialism & Liberation Party Nominees | 14 | 0.04% | |
Socialist Workers Party Nominees | 11 | 0.03% | |
Republican Party Nominees | 18,199 | 47.25% | |
Independent Candidates | 478 | 1.24% | |
| Total Votes | 38,519 | 100% | |
| Clark | |||
Democratic Party Nominees | 95,356 | 52.17% | |
Libertarian Party Nominees | 581 | 0.32% | |
Constitution Party Nominees | 622 | 0.34% | |
Green Party Nominees | 140 | 0.08% | |
Socialism & Liberation Party Nominees | 36 | 0.02% | |
Socialist Workers Party Nominees | 26 | 0.01% | |
Republican Party Nominees | 84,212 | 46.08% | |
Independent Candidates | 1,791 | 0.98% | |
| Total Votes | 182,764 | 100% | |
| Columbia | |||
Democratic Party Nominees | 686 | 30.79% | |
Libertarian Party Nominees | 1 | 0.04% | |
Constitution Party Nominees | 11 | 0.49% | |
Green Party Nominees | 3 | 0.13% | |
Socialism & Liberation Party Nominees | 2 | 0.09% | |
Socialist Workers Party Nominees | 0% | ||
Republican Party Nominees | 1,499 | 67.28% | |
Independent Candidates | 26 | 1.17% | |
| Total Votes | 2,228 | 100% | |
| Cowlitz | |||
Democratic Party Nominees | 24,597 | 54.38% | |
Libertarian Party Nominees | 144 | 0.32% | |
Constitution Party Nominees | 191 | 0.42% | |
Green Party Nominees | 71 | 0.16% | |
Socialism & Liberation Party Nominees | 16 | 0.04% | |
Socialist Workers Party Nominees | 11 | 0.02% | |
Republican Party Nominees | 19,554 | 43.23% | |
Independent Candidates | 645 | 1.43% | |
| Total Votes | 45,229 | 100% | |
| Douglas | |||
Democratic Party Nominees | 5,848 | 38.45% | |
Libertarian Party Nominees | 59 | 0.39% | |
Constitution Party Nominees | 44 | 0.29% | |
Green Party Nominees | 15 | 0.1% | |
Socialism & Liberation Party Nominees | 0% | ||
Socialist Workers Party Nominees | 4 | 0.03% | |
Republican Party Nominees | 9,098 | 59.82% | |
Independent Candidates | 141 | 0.93% | |
| Total Votes | 15,209 | 100% | |
| Ferry | |||
Democratic Party Nominees | 1,467 | 41.9% | |
Libertarian Party Nominees | 27 | 0.77% | |
Constitution Party Nominees | 32 | 0.91% | |
Green Party Nominees | 12 | 0.34% | |
Socialism & Liberation Party Nominees | 1 | 0.03% | |
Socialist Workers Party Nominees | 1 | 0.03% | |
Republican Party Nominees | 1,916 | 54.73% | |
Independent Candidates | 45 | 1.29% | |
| Total Votes | 3,501 | 100% | |
| Franklin | |||
Democratic Party Nominees | 7,361 | 37.37% | |
Libertarian Party Nominees | 57 | 0.29% | |
Constitution Party Nominees | 63 | 0.32% | |
Green Party Nominees | 11 | 0.06% | |
Socialism & Liberation Party Nominees | 4 | 0.02% | |
Socialist Workers Party Nominees | 6 | 0.03% | |
Republican Party Nominees | 12,037 | 61.11% | |
Independent Candidates | 157 | 0.8% | |
| Total Votes | 19,696 | 100% | |
| Garfield | |||
Democratic Party Nominees | 385 | 28.04% | |
Libertarian Party Nominees | 4 | 0.29% | |
Constitution Party Nominees | 2 | 0.15% | |
Green Party Nominees | 1 | 0.07% | |
Socialism & Liberation Party Nominees | 0% | ||
Socialist Workers Party Nominees | 2 | 0.15% | |
Republican Party Nominees | 968 | 70.5% | |
Independent Candidates | 11 | 0.8% | |
| Total Votes | 1,373 | 100% | |
| Grant | |||
Democratic Party Nominees | 9,601 | 34.99% | |
Libertarian Party Nominees | 104 | 0.38% | |
Constitution Party Nominees | 207 | 0.75% | |
Green Party Nominees | 25 | 0.09% | |
Socialism & Liberation Party Nominees | 10 | 0.04% | |
Socialist Workers Party Nominees | 9 | 0.03% | |
Republican Party Nominees | 17,153 | 62.52% | |
Independent Candidates | 329 | 1.2% | |
| Total Votes | 27,438 | 100% | |
| Grays Harbor | |||
Democratic Party Nominees | 16,354 | 56.04% | |
Libertarian Party Nominees | 132 | 0.45% | |
Constitution Party Nominees | 109 | 0.37% | |
Green Party Nominees | 50 | 0.17% | |
Socialism & Liberation Party Nominees | 11 | 0.04% | |
Socialist Workers Party Nominees | 4 | 0.01% | |
Republican Party Nominees | 12,104 | 41.47% | |
Independent Candidates | 420 | 1.44% | |
| Total Votes | 29,184 | 100% | |
| Island | |||
Democratic Party Nominees | 22,058 | 52.32% | |
Libertarian Party Nominees | 173 | 0.41% | |
Constitution Party Nominees | 93 | 0.22% | |
Green Party Nominees | 49 | 0.12% | |
Socialism & Liberation Party Nominees | 4 | 0.01% | |
Socialist Workers Party Nominees | 6 | 0.01% | |
Republican Party Nominees | 19,426 | 46.08% | |
Independent Candidates | 350 | 0.83% | |
| Total Votes | 42,159 | 100% | |
| Jefferson | |||
Democratic Party Nominees | 13,252 | 66.29% | |
Libertarian Party Nominees | 98 | 0.49% | |
Constitution Party Nominees | 44 | 0.22% | |
Green Party Nominees | 50 | 0.25% | |
Socialism & Liberation Party Nominees | 8 | 0.04% | |
Socialist Workers Party Nominees | 0% | ||
Republican Party Nominees | 6,330 | 31.66% | |
Independent Candidates | 209 | 1.05% | |
| Total Votes | 19,991 | 100% | |
| King | |||
Democratic Party Nominees | 648,230 | 70.3% | |
Libertarian Party Nominees | 4,058 | 0.44% | |
Constitution Party Nominees | 1,471 | 0.16% | |
Green Party Nominees | 1,199 | 0.13% | |
Socialism & Liberation Party Nominees | 159 | 0.02% | |
Socialist Workers Party Nominees | 217 | 0.02% | |
Republican Party Nominees | 259,716 | 28.17% | |
Independent Candidates | 6,982 | 0.76% | |
| Total Votes | 922,032 | 100% | |
| Kitsap | |||
Democratic Party Nominees | 68,624 | 55.19% | |
Libertarian Party Nominees | 594 | 0.48% | |
Constitution Party Nominees | 392 | 0.32% | |
Green Party Nominees | 114 | 0.09% | |
Socialism & Liberation Party Nominees | 34 | 0.03% | |
Socialist Workers Party Nominees | 18 | 0.01% | |
Republican Party Nominees | 53,297 | 42.86% | |
Independent Candidates | 1,264 | 1.02% | |
| Total Votes | 124,337 | 100% | |
| Kittitas | |||
Democratic Party Nominees | 8,030 | 44.94% | |
Libertarian Party Nominees | 80 | 0.45% | |
Constitution Party Nominees | 74 | 0.41% | |
Green Party Nominees | 18 | 0.1% | |
Socialism & Liberation Party Nominees | 5 | 0.03% | |
Socialist Workers Party Nominees | 2 | 0.01% | |
Republican Party Nominees | 9,471 | 53.01% | |
Independent Candidates | 188 | 1.05% | |
| Total Votes | 17,868 | 100% | |
| Klickitat | |||
Democratic Party Nominees | 4,965 | 48.85% | |
Libertarian Party Nominees | 45 | 0.44% | |
Constitution Party Nominees | 48 | 0.47% | |
Green Party Nominees | 16 | 0.16% | |
Socialism & Liberation Party Nominees | 4 | 0.04% | |
Socialist Workers Party Nominees | 3 | 0.03% | |
Republican Party Nominees | 4,944 | 48.64% | |
Independent Candidates | 139 | 1.37% | |
| Total Votes | 10,164 | 100% | |
| Lewis | |||
Democratic Party Nominees | 13,624 | 39.26% | |
Libertarian Party Nominees | 138 | 0.4% | |
Constitution Party Nominees | 205 | 0.59% | |
Green Party Nominees | 35 | 0.1% | |
Socialism & Liberation Party Nominees | 12 | 0.03% | |
Socialist Workers Party Nominees | 10 | 0.03% | |
Republican Party Nominees | 20,278 | 58.43% | |
Independent Candidates | 403 | 1.16% | |
| Total Votes | 34,705 | 100% | |
| Lincoln | |||
Democratic Party Nominees | 2,032 | 34% | |
Libertarian Party Nominees | 17 | 0.28% | |
Constitution Party Nominees | 40 | 0.67% | |
Green Party Nominees | 6 | 0.1% | |
Socialism & Liberation Party Nominees | 1 | 0.02% | |
Socialist Workers Party Nominees | 3 | 0.05% | |
Republican Party Nominees | 3,803 | 63.63% | |
Independent Candidates | 75 | 1.25% | |
| Total Votes | 5,977 | 100% | |
| Mason | |||
Democratic Party Nominees | 15,050 | 53.17% | |
Libertarian Party Nominees | 128 | 0.45% | |
Constitution Party Nominees | 115 | 0.41% | |
Green Party Nominees | 43 | 0.15% | |
Socialism & Liberation Party Nominees | 7 | 0.02% | |
Socialist Workers Party Nominees | 5 | 0.02% | |
Republican Party Nominees | 12,600 | 44.51% | |
Independent Candidates | 358 | 1.26% | |
| Total Votes | 28,306 | 100% | |
| Okanogan | |||
Democratic Party Nominees | 7,613 | 45.13% | |
Libertarian Party Nominees | 87 | 0.52% | |
Constitution Party Nominees | 105 | 0.62% | |
Green Party Nominees | 30 | 0.18% | |
Socialism & Liberation Party Nominees | 4 | 0.02% | |
Socialist Workers Party Nominees | 9 | 0.05% | |
Republican Party Nominees | 8,798 | 52.15% | |
Independent Candidates | 224 | 1.33% | |
| Total Votes | 16,870 | 100% | |
| Pacific | |||
Democratic Party Nominees | 6,094 | 55.72% | |
Libertarian Party Nominees | 43 | 0.39% | |
Constitution Party Nominees | 49 | 0.45% | |
Green Party Nominees | 17 | 0.16% | |
Socialism & Liberation Party Nominees | 2 | 0.02% | |
Socialist Workers Party Nominees | 4 | 0.04% | |
Republican Party Nominees | 4,555 | 41.65% | |
Independent Candidates | 173 | 1.58% | |
| Total Votes | 10,937 | 100% | |
| Pend Oreille | |||
Democratic Party Nominees | 2,562 | 39.1% | |
Libertarian Party Nominees | 40 | 0.61% | |
Constitution Party Nominees | 80 | 1.22% | |
Green Party Nominees | 8 | 0.12% | |
Socialism & Liberation Party Nominees | 2 | 0.03% | |
Socialist Workers Party Nominees | 4 | 0.06% | |
Republican Party Nominees | 3,717 | 56.73% | |
Independent Candidates | 139 | 2.12% | |
| Total Votes | 6,552 | 100% | |
| Pierce | |||
Democratic Party Nominees | 181,824 | 55.18% | |
Libertarian Party Nominees | 1,388 | 0.42% | |
Constitution Party Nominees | 804 | 0.24% | |
Green Party Nominees | 339 | 0.1% | |
Socialism & Liberation Party Nominees | 81 | 0.02% | |
Socialist Workers Party Nominees | 66 | 0.02% | |
Republican Party Nominees | 141,673 | 42.99% | |
Independent Candidates | 3,345 | 1.02% | |
| Total Votes | 329,520 | 100% | |
| San Juan | |||
Democratic Party Nominees | 7,374 | 70.02% | |
Libertarian Party Nominees | 57 | 0.54% | |
Constitution Party Nominees | 16 | 0.15% | |
Green Party Nominees | 26 | 0.25% | |
Socialism & Liberation Party Nominees | 5 | 0.05% | |
Socialist Workers Party Nominees | 0% | ||
Republican Party Nominees | 2,958 | 28.09% | |
Independent Candidates | 95 | 0.9% | |
| Total Votes | 10,531 | 100% | |
| Skagit | |||
Democratic Party Nominees | 30,053 | 53.78% | |
Libertarian Party Nominees | 244 | 0.44% | |
Constitution Party Nominees | 185 | 0.33% | |
Green Party Nominees | 84 | 0.15% | |
Socialism & Liberation Party Nominees | 12 | 0.02% | |
Socialist Workers Party Nominees | 11 | 0.02% | |
Republican Party Nominees | 24,687 | 44.17% | |
Independent Candidates | 610 | 1.09% | |
| Total Votes | 55,886 | 100% | |
| Skamania | |||
Democratic Party Nominees | 2,817 | 51.31% | |
Libertarian Party Nominees | 18 | 0.33% | |
Constitution Party Nominees | 41 | 0.75% | |
Green Party Nominees | 5 | 0.09% | |
Socialism & Liberation Party Nominees | 2 | 0.04% | |
Socialist Workers Party Nominees | 1 | 0.02% | |
Republican Party Nominees | 2,524 | 45.97% | |
Independent Candidates | 82 | 1.49% | |
| Total Votes | 5,490 | 100% | |
| Snohomish | |||
Democratic Party Nominees | 187,294 | 58.47% | |
Libertarian Party Nominees | 1,559 | 0.49% | |
Constitution Party Nominees | 972 | 0.3% | |
Green Party Nominees | 331 | 0.1% | |
Socialism & Liberation Party Nominees | 70 | 0.02% | |
Socialist Workers Party Nominees | 73 | 0.02% | |
Republican Party Nominees | 126,722 | 39.56% | |
Independent Candidates | 3,312 | 1.03% | |
| Total Votes | 320,333 | 100% | |
| Spokane | |||
Democratic Party Nominees | 105,786 | 48.19% | |
Libertarian Party Nominees | 870 | 0.4% | |
Constitution Party Nominees | 1,499 | 0.68% | |
Green Party Nominees | 299 | 0.14% | |
Socialism & Liberation Party Nominees | 71 | 0.03% | |
Socialist Workers Party Nominees | 37 | 0.02% | |
Republican Party Nominees | 108,314 | 49.34% | |
Independent Candidates | 2,635 | 1.2% | |
| Total Votes | 219,511 | 100% | |
| Stevens | |||
Democratic Party Nominees | 8,499 | 38.04% | |
Libertarian Party Nominees | 96 | 0.43% | |
Constitution Party Nominees | 258 | 1.15% | |
Green Party Nominees | 25 | 0.11% | |
Socialism & Liberation Party Nominees | 4 | 0.02% | |
Socialist Workers Party Nominees | 1 | 0% | |
Republican Party Nominees | 13,132 | 58.78% | |
Independent Candidates | 326 | 1.46% | |
| Total Votes | 22,341 | 100% | |
| Thurston | |||
Democratic Party Nominees | 75,882 | 59.89% | |
Libertarian Party Nominees | 507 | 0.4% | |
Constitution Party Nominees | 308 | 0.24% | |
Green Party Nominees | 318 | 0.25% | |
Socialism & Liberation Party Nominees | 48 | 0.04% | |
Socialist Workers Party Nominees | 15 | 0.01% | |
Republican Party Nominees | 48,366 | 38.17% | |
Independent Candidates | 1,265 | 1% | |
| Total Votes | 126,709 | 100% | |
| Wahkiakum | |||
Democratic Party Nominees | 1,121 | 48.87% | |
Libertarian Party Nominees | 10 | 0.44% | |
Constitution Party Nominees | 9 | 0.39% | |
Green Party Nominees | 2 | 0.09% | |
Socialism & Liberation Party Nominees | 1 | 0.04% | |
Socialist Workers Party Nominees | 2 | 0.09% | |
Republican Party Nominees | 1,105 | 48.17% | |
Independent Candidates | 44 | 1.92% | |
| Total Votes | 2,294 | 100% | |
| Walla Walla | |||
Democratic Party Nominees | 10,081 | 40.77% | |
Libertarian Party Nominees | 82 | 0.33% | |
Constitution Party Nominees | 84 | 0.34% | |
Green Party Nominees | 28 | 0.11% | |
Socialism & Liberation Party Nominees | 7 | 0.03% | |
Socialist Workers Party Nominees | 8 | 0.03% | |
Republican Party Nominees | 14,182 | 57.35% | |
Independent Candidates | 255 | 1.03% | |
| Total Votes | 24,727 | 100% | |
| Whatcom | |||
Democratic Party Nominees | 58,236 | 58.04% | |
Libertarian Party Nominees | 327 | 0.33% | |
Constitution Party Nominees | 316 | 0.31% | |
Green Party Nominees | 210 | 0.21% | |
Socialism & Liberation Party Nominees | 17 | 0.02% | |
Socialist Workers Party Nominees | 23 | 0.02% | |
Republican Party Nominees | 40,205 | 40.07% | |
Independent Candidates | 1,005 | 1% | |
| Total Votes | 100,339 | 100% | |
| Whitman | |||
Democratic Party Nominees | 9,070 | 51.57% | |
Libertarian Party Nominees | 104 | 0.59% | |
Constitution Party Nominees | 66 | 0.38% | |
Green Party Nominees | 26 | 0.15% | |
Socialism & Liberation Party Nominees | 8 | 0.05% | |
Socialist Workers Party Nominees | 6 | 0.03% | |
Republican Party Nominees | 8,104 | 46.07% | |
Independent Candidates | 205 | 1.17% | |
| Total Votes | 17,589 | 100% | |
| Yakima | |||
Democratic Party Nominees | 33,792 | 43.85% | |
Libertarian Party Nominees | 208 | 0.27% | |
Constitution Party Nominees | 327 | 0.42% | |
Green Party Nominees | 61 | 0.08% | |
Socialism & Liberation Party Nominees | 23 | 0.03% | |
Socialist Workers Party Nominees | 22 | 0.03% | |
Republican Party Nominees | 41,946 | 54.43% | |
Independent Candidates | 683 | 0.89% | |
| Total Votes | 77,062 | 100% | |