


November 04, 2008 General Election Results
Lt. Governor - County Results
Last updated on 11/26/2008 9:41 AM
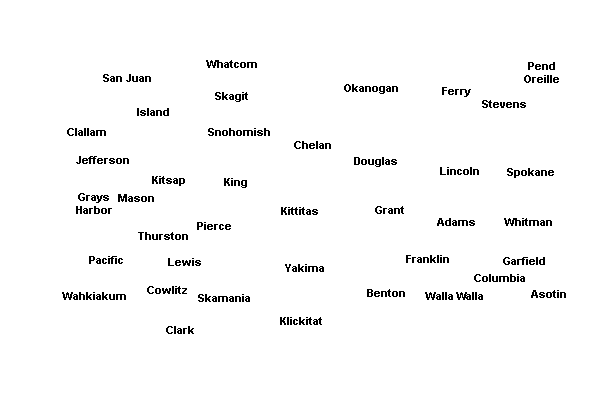
The boxes identify the two candidates receiving the most votes. The map displays the top vote-getter by county, which may include candidates other than the two receiving the most votes overall.
Total
60.8%
Brad Owen(Prefers Democratic Party)
1,718,033
39.2%
Marcia McCraw(Prefers Republican Party)
1,107,634
Adams County
55.82%
Marcia McCraw2,507
44.18%
Brad Owen1,984
Asotin County
50.57%
Brad Owen4,656
49.43%
Marcia McCraw4,551
Benton County
53.91%
Marcia McCraw37,218
46.09%
Brad Owen31,815
Chelan County
52.67%
Marcia McCraw15,753
47.33%
Brad Owen14,158
Clallam County
58.92%
Brad Owen21,519
41.08%
Marcia McCraw15,003
Clark County
55.35%
Brad Owen94,611
44.65%
Marcia McCraw76,323
Columbia County
52.89%
Marcia McCraw1,098
47.11%
Brad Owen978
Cowlitz County
59.35%
Brad Owen25,234
40.65%
Marcia McCraw17,280
Douglas County
54.99%
Marcia McCraw7,783
45.01%
Brad Owen6,370
Ferry County
50.94%
Marcia McCraw1,661
49.06%
Brad Owen1,600
Franklin County
52.4%
Marcia McCraw9,873
47.6%
Brad Owen8,967
Garfield County
54.34%
Marcia McCraw688
45.66%
Brad Owen578
Grant County
57.02%
Marcia McCraw14,797
42.98%
Brad Owen11,153
Grays Harbor County
70.04%
Brad Owen19,540
29.96%
Marcia McCraw8,360
Island County
56.36%
Brad Owen22,150
43.64%
Marcia McCraw17,149
Jefferson County
69.64%
Brad Owen13,192
30.36%
Marcia McCraw5,750
King County
67.63%
Brad Owen564,821
32.37%
Marcia McCraw270,379
Kitsap County
61.21%
Brad Owen72,170
38.79%
Marcia McCraw45,728
Kittitas County
52.98%
Brad Owen8,871
47.02%
Marcia McCraw7,874
Klickitat County
54.61%
Brad Owen5,178
45.39%
Marcia McCraw4,304
Lewis County
50.75%
Brad Owen16,517
49.25%
Marcia McCraw16,032
Lincoln County
50.9%
Marcia McCraw2,811
49.1%
Brad Owen2,712
Mason County
67.78%
Brad Owen18,544
32.22%
Marcia McCraw8,817
Okanogan County
52.05%
Brad Owen8,159
47.95%
Marcia McCraw7,516
Pacific County
65.04%
Brad Owen6,708
34.96%
Marcia McCraw3,605
Pend Oreille County
51.68%
Marcia McCraw3,192
48.32%
Brad Owen2,984
Pierce County
60.13%
Brad Owen186,013
39.87%
Marcia McCraw123,353
San Juan County
69%
Brad Owen6,863
31%
Marcia McCraw3,084
Skagit County
58.81%
Brad Owen30,861
41.19%
Marcia McCraw21,613
Skamania County
57.02%
Brad Owen2,886
42.98%
Marcia McCraw2,175
Snohomish County
61.42%
Brad Owen185,108
38.58%
Marcia McCraw116,276
Spokane County
55.15%
Brad Owen114,233
44.85%
Marcia McCraw92,910
Stevens County
55.36%
Marcia McCraw11,566
44.64%
Brad Owen9,327
Thurston County
67.25%
Brad Owen80,063
32.75%
Marcia McCraw38,995
Wahkiakum County
56.03%
Brad Owen1,185
43.97%
Marcia McCraw930
Walla Walla County
50.56%
Brad Owen11,657
49.44%
Marcia McCraw11,401
Whatcom County
59.79%
Brad Owen56,318
40.21%
Marcia McCraw37,879
Whitman County
56.01%
Brad Owen9,034
43.99%
Marcia McCraw7,096
Yakima County
53.4%
Brad Owen39,316
46.6%
Marcia McCraw34,304


| Lt. Governor | |||
| County | Candidate | Vote | Vote % |
|---|---|---|---|
| Adams | |||
(Prefers Democratic Party) | 1,984 | 44.18% | |
(Prefers Republican Party) | 2,507 | 55.82% | |
| Total Votes | 4,491 | 100% | |
| Asotin | |||
(Prefers Democratic Party) | 4,656 | 50.57% | |
(Prefers Republican Party) | 4,551 | 49.43% | |
| Total Votes | 9,207 | 100% | |
| Benton | |||
(Prefers Democratic Party) | 31,815 | 46.09% | |
(Prefers Republican Party) | 37,218 | 53.91% | |
| Total Votes | 69,033 | 100% | |
| Chelan | |||
(Prefers Democratic Party) | 14,158 | 47.33% | |
(Prefers Republican Party) | 15,753 | 52.67% | |
| Total Votes | 29,911 | 100% | |
| Clallam | |||
(Prefers Democratic Party) | 21,519 | 58.92% | |
(Prefers Republican Party) | 15,003 | 41.08% | |
| Total Votes | 36,522 | 100% | |
| Clark | |||
(Prefers Democratic Party) | 94,611 | 55.35% | |
(Prefers Republican Party) | 76,323 | 44.65% | |
| Total Votes | 170,934 | 100% | |
| Columbia | |||
(Prefers Democratic Party) | 978 | 47.11% | |
(Prefers Republican Party) | 1,098 | 52.89% | |
| Total Votes | 2,076 | 100% | |
| Cowlitz | |||
(Prefers Democratic Party) | 25,234 | 59.35% | |
(Prefers Republican Party) | 17,280 | 40.65% | |
| Total Votes | 42,514 | 100% | |
| Douglas | |||
(Prefers Democratic Party) | 6,370 | 45.01% | |
(Prefers Republican Party) | 7,783 | 54.99% | |
| Total Votes | 14,153 | 100% | |
| Ferry | |||
(Prefers Democratic Party) | 1,600 | 49.06% | |
(Prefers Republican Party) | 1,661 | 50.94% | |
| Total Votes | 3,261 | 100% | |
| Franklin | |||
(Prefers Democratic Party) | 8,967 | 47.6% | |
(Prefers Republican Party) | 9,873 | 52.4% | |
| Total Votes | 18,840 | 100% | |
| Garfield | |||
(Prefers Democratic Party) | 578 | 45.66% | |
(Prefers Republican Party) | 688 | 54.34% | |
| Total Votes | 1,266 | 100% | |
| Grant | |||
(Prefers Democratic Party) | 11,153 | 42.98% | |
(Prefers Republican Party) | 14,797 | 57.02% | |
| Total Votes | 25,950 | 100% | |
| Grays Harbor | |||
(Prefers Democratic Party) | 19,540 | 70.04% | |
(Prefers Republican Party) | 8,360 | 29.96% | |
| Total Votes | 27,900 | 100% | |
| Island | |||
(Prefers Democratic Party) | 22,150 | 56.36% | |
(Prefers Republican Party) | 17,149 | 43.64% | |
| Total Votes | 39,299 | 100% | |
| Jefferson | |||
(Prefers Democratic Party) | 13,192 | 69.64% | |
(Prefers Republican Party) | 5,750 | 30.36% | |
| Total Votes | 18,942 | 100% | |
| King | |||
(Prefers Democratic Party) | 564,821 | 67.63% | |
(Prefers Republican Party) | 270,379 | 32.37% | |
| Total Votes | 835,200 | 100% | |
| Kitsap | |||
(Prefers Democratic Party) | 72,170 | 61.21% | |
(Prefers Republican Party) | 45,728 | 38.79% | |
| Total Votes | 117,898 | 100% | |
| Kittitas | |||
(Prefers Democratic Party) | 8,871 | 52.98% | |
(Prefers Republican Party) | 7,874 | 47.02% | |
| Total Votes | 16,745 | 100% | |
| Klickitat | |||
(Prefers Democratic Party) | 5,178 | 54.61% | |
(Prefers Republican Party) | 4,304 | 45.39% | |
| Total Votes | 9,482 | 100% | |
| Lewis | |||
(Prefers Democratic Party) | 16,517 | 50.75% | |
(Prefers Republican Party) | 16,032 | 49.25% | |
| Total Votes | 32,549 | 100% | |
| Lincoln | |||
(Prefers Democratic Party) | 2,712 | 49.1% | |
(Prefers Republican Party) | 2,811 | 50.9% | |
| Total Votes | 5,523 | 100% | |
| Mason | |||
(Prefers Democratic Party) | 18,544 | 67.78% | |
(Prefers Republican Party) | 8,817 | 32.22% | |
| Total Votes | 27,361 | 100% | |
| Okanogan | |||
(Prefers Democratic Party) | 8,159 | 52.05% | |
(Prefers Republican Party) | 7,516 | 47.95% | |
| Total Votes | 15,675 | 100% | |
| Pacific | |||
(Prefers Democratic Party) | 6,708 | 65.04% | |
(Prefers Republican Party) | 3,605 | 34.96% | |
| Total Votes | 10,313 | 100% | |
| Pend Oreille | |||
(Prefers Democratic Party) | 2,984 | 48.32% | |
(Prefers Republican Party) | 3,192 | 51.68% | |
| Total Votes | 6,176 | 100% | |
| Pierce | |||
(Prefers Democratic Party) | 186,013 | 60.13% | |
(Prefers Republican Party) | 123,353 | 39.87% | |
| Total Votes | 309,366 | 100% | |
| San Juan | |||
(Prefers Democratic Party) | 6,863 | 69% | |
(Prefers Republican Party) | 3,084 | 31% | |
| Total Votes | 9,947 | 100% | |
| Skagit | |||
(Prefers Democratic Party) | 30,861 | 58.81% | |
(Prefers Republican Party) | 21,613 | 41.19% | |
| Total Votes | 52,474 | 100% | |
| Skamania | |||
(Prefers Democratic Party) | 2,886 | 57.02% | |
(Prefers Republican Party) | 2,175 | 42.98% | |
| Total Votes | 5,061 | 100% | |
| Snohomish | |||
(Prefers Democratic Party) | 185,108 | 61.42% | |
(Prefers Republican Party) | 116,276 | 38.58% | |
| Total Votes | 301,384 | 100% | |
| Spokane | |||
(Prefers Democratic Party) | 114,233 | 55.15% | |
(Prefers Republican Party) | 92,910 | 44.85% | |
| Total Votes | 207,143 | 100% | |
| Stevens | |||
(Prefers Democratic Party) | 9,327 | 44.64% | |
(Prefers Republican Party) | 11,566 | 55.36% | |
| Total Votes | 20,893 | 100% | |
| Thurston | |||
(Prefers Democratic Party) | 80,063 | 67.25% | |
(Prefers Republican Party) | 38,995 | 32.75% | |
| Total Votes | 119,058 | 100% | |
| Wahkiakum | |||
(Prefers Democratic Party) | 1,185 | 56.03% | |
(Prefers Republican Party) | 930 | 43.97% | |
| Total Votes | 2,115 | 100% | |
| Walla Walla | |||
(Prefers Democratic Party) | 11,657 | 50.56% | |
(Prefers Republican Party) | 11,401 | 49.44% | |
| Total Votes | 23,058 | 100% | |
| Whatcom | |||
(Prefers Democratic Party) | 56,318 | 59.79% | |
(Prefers Republican Party) | 37,879 | 40.21% | |
| Total Votes | 94,197 | 100% | |
| Whitman | |||
(Prefers Democratic Party) | 9,034 | 56.01% | |
(Prefers Republican Party) | 7,096 | 43.99% | |
| Total Votes | 16,130 | 100% | |
| Yakima | |||
(Prefers Democratic Party) | 39,316 | 53.4% | |
(Prefers Republican Party) | 34,304 | 46.6% | |
| Total Votes | 73,620 | 100% | |