


November 04, 2008 General Election Results
Governor - County Results
Last updated on 11/26/2008 9:41 AM
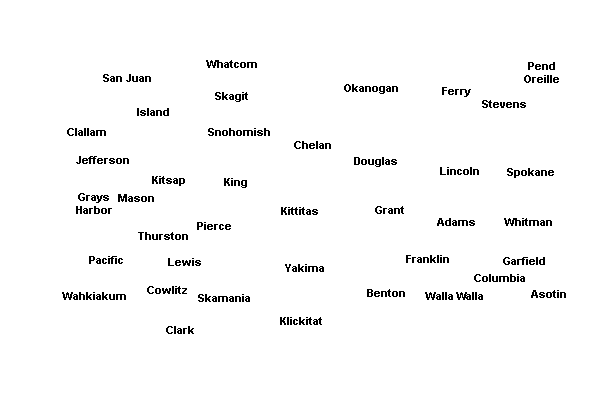
The boxes identify the two candidates receiving the most votes. The map displays the top vote-getter by county, which may include candidates other than the two receiving the most votes overall.
Total
53.24%
Christine Gregoire(Prefers Democratic Party)
1,598,738
46.76%
Dino Rossi(Prefers G.O.P. Party)
1,404,124
Adams County
69.83%
Dino Rossi3,363
30.17%
Christine Gregoire1,453
Asotin County
56.08%
Dino Rossi5,432
43.92%
Christine Gregoire4,254
Benton County
69.74%
Dino Rossi50,635
30.26%
Christine Gregoire21,968
Chelan County
62.01%
Dino Rossi19,730
37.99%
Christine Gregoire12,087
Clallam County
50.58%
Dino Rossi19,431
49.42%
Christine Gregoire18,987
Clark County
51.01%
Dino Rossi91,301
48.99%
Christine Gregoire87,683
Columbia County
68.52%
Dino Rossi1,537
31.48%
Christine Gregoire706
Cowlitz County
53.62%
Dino Rossi23,954
46.38%
Christine Gregoire20,723
Douglas County
66.13%
Dino Rossi10,013
33.87%
Christine Gregoire5,128
Ferry County
61.67%
Dino Rossi2,140
38.33%
Christine Gregoire1,330
Franklin County
67.59%
Dino Rossi13,276
32.41%
Christine Gregoire6,365
Garfield County
67.99%
Dino Rossi922
32.01%
Christine Gregoire434
Grant County
68.06%
Dino Rossi18,604
31.94%
Christine Gregoire8,732
Grays Harbor County
53.98%
Christine Gregoire15,729
46.02%
Dino Rossi13,407
Island County
50.24%
Christine Gregoire20,891
49.76%
Dino Rossi20,688
Jefferson County
63.61%
Christine Gregoire12,588
36.39%
Dino Rossi7,200
King County
64.16%
Christine Gregoire583,357
35.84%
Dino Rossi325,820
Kitsap County
50.74%
Christine Gregoire62,478
49.26%
Dino Rossi60,656
Kittitas County
60.56%
Dino Rossi10,732
39.44%
Christine Gregoire6,988
Klickitat County
54.58%
Dino Rossi5,454
45.42%
Christine Gregoire4,538
Lewis County
64.53%
Dino Rossi22,347
35.47%
Christine Gregoire12,283
Lincoln County
65.34%
Dino Rossi3,868
34.66%
Christine Gregoire2,052
Mason County
50.42%
Dino Rossi14,181
49.58%
Christine Gregoire13,942
Okanogan County
60.73%
Dino Rossi10,168
39.27%
Christine Gregoire6,575
Pacific County
52.28%
Christine Gregoire5,695
47.72%
Dino Rossi5,198
Pend Oreille County
60.34%
Dino Rossi3,912
39.66%
Christine Gregoire2,571
Pierce County
51.1%
Christine Gregoire166,562
48.9%
Dino Rossi159,363
San Juan County
67.73%
Christine Gregoire7,044
32.27%
Dino Rossi3,356
Skagit County
50.33%
Christine Gregoire27,915
49.67%
Dino Rossi27,545
Skamania County
52.32%
Dino Rossi2,813
47.68%
Christine Gregoire2,564
Snohomish County
52.67%
Christine Gregoire167,175
47.33%
Dino Rossi150,205
Spokane County
51.89%
Dino Rossi112,570
48.11%
Christine Gregoire104,369
Stevens County
64.98%
Dino Rossi14,418
35.02%
Christine Gregoire7,771
Thurston County
57.88%
Christine Gregoire72,652
42.12%
Dino Rossi52,880
Wahkiakum County
58.08%
Dino Rossi1,330
41.92%
Christine Gregoire960
Walla Walla County
61.68%
Dino Rossi15,137
38.32%
Christine Gregoire9,405
Whatcom County
54.67%
Christine Gregoire54,249
45.33%
Dino Rossi44,975
Whitman County
51.54%
Dino Rossi8,896
48.46%
Christine Gregoire8,363
Yakima County
60.73%
Dino Rossi46,667
39.27%
Christine Gregoire30,172


| Governor | |||
| County | Candidate | Vote | Vote % |
|---|---|---|---|
| Adams | |||
(Prefers Democratic Party) | 1,453 | 30.17% | |
(Prefers G.O.P. Party) | 3,363 | 69.83% | |
| Total Votes | 4,816 | 100% | |
| Asotin | |||
(Prefers Democratic Party) | 4,254 | 43.92% | |
(Prefers G.O.P. Party) | 5,432 | 56.08% | |
| Total Votes | 9,686 | 100% | |
| Benton | |||
(Prefers Democratic Party) | 21,968 | 30.26% | |
(Prefers G.O.P. Party) | 50,635 | 69.74% | |
| Total Votes | 72,603 | 100% | |
| Chelan | |||
(Prefers Democratic Party) | 12,087 | 37.99% | |
(Prefers G.O.P. Party) | 19,730 | 62.01% | |
| Total Votes | 31,817 | 100% | |
| Clallam | |||
(Prefers Democratic Party) | 18,987 | 49.42% | |
(Prefers G.O.P. Party) | 19,431 | 50.58% | |
| Total Votes | 38,418 | 100% | |
| Clark | |||
(Prefers Democratic Party) | 87,683 | 48.99% | |
(Prefers G.O.P. Party) | 91,301 | 51.01% | |
| Total Votes | 178,984 | 100% | |
| Columbia | |||
(Prefers Democratic Party) | 706 | 31.48% | |
(Prefers G.O.P. Party) | 1,537 | 68.52% | |
| Total Votes | 2,243 | 100% | |
| Cowlitz | |||
(Prefers Democratic Party) | 20,723 | 46.38% | |
(Prefers G.O.P. Party) | 23,954 | 53.62% | |
| Total Votes | 44,677 | 100% | |
| Douglas | |||
(Prefers Democratic Party) | 5,128 | 33.87% | |
(Prefers G.O.P. Party) | 10,013 | 66.13% | |
| Total Votes | 15,141 | 100% | |
| Ferry | |||
(Prefers Democratic Party) | 1,330 | 38.33% | |
(Prefers G.O.P. Party) | 2,140 | 61.67% | |
| Total Votes | 3,470 | 100% | |
| Franklin | |||
(Prefers Democratic Party) | 6,365 | 32.41% | |
(Prefers G.O.P. Party) | 13,276 | 67.59% | |
| Total Votes | 19,641 | 100% | |
| Garfield | |||
(Prefers Democratic Party) | 434 | 32.01% | |
(Prefers G.O.P. Party) | 922 | 67.99% | |
| Total Votes | 1,356 | 100% | |
| Grant | |||
(Prefers Democratic Party) | 8,732 | 31.94% | |
(Prefers G.O.P. Party) | 18,604 | 68.06% | |
| Total Votes | 27,336 | 100% | |
| Grays Harbor | |||
(Prefers Democratic Party) | 15,729 | 53.98% | |
(Prefers G.O.P. Party) | 13,407 | 46.02% | |
| Total Votes | 29,136 | 100% | |
| Island | |||
(Prefers Democratic Party) | 20,891 | 50.24% | |
(Prefers G.O.P. Party) | 20,688 | 49.76% | |
| Total Votes | 41,579 | 100% | |
| Jefferson | |||
(Prefers Democratic Party) | 12,588 | 63.61% | |
(Prefers G.O.P. Party) | 7,200 | 36.39% | |
| Total Votes | 19,788 | 100% | |
| King | |||
(Prefers Democratic Party) | 583,357 | 64.16% | |
(Prefers G.O.P. Party) | 325,820 | 35.84% | |
| Total Votes | 909,177 | 100% | |
| Kitsap | |||
(Prefers Democratic Party) | 62,478 | 50.74% | |
(Prefers G.O.P. Party) | 60,656 | 49.26% | |
| Total Votes | 123,134 | 100% | |
| Kittitas | |||
(Prefers Democratic Party) | 6,988 | 39.44% | |
(Prefers G.O.P. Party) | 10,732 | 60.56% | |
| Total Votes | 17,720 | 100% | |
| Klickitat | |||
(Prefers Democratic Party) | 4,538 | 45.42% | |
(Prefers G.O.P. Party) | 5,454 | 54.58% | |
| Total Votes | 9,992 | 100% | |
| Lewis | |||
(Prefers Democratic Party) | 12,283 | 35.47% | |
(Prefers G.O.P. Party) | 22,347 | 64.53% | |
| Total Votes | 34,630 | 100% | |
| Lincoln | |||
(Prefers Democratic Party) | 2,052 | 34.66% | |
(Prefers G.O.P. Party) | 3,868 | 65.34% | |
| Total Votes | 5,920 | 100% | |
| Mason | |||
(Prefers Democratic Party) | 13,942 | 49.58% | |
(Prefers G.O.P. Party) | 14,181 | 50.42% | |
| Total Votes | 28,123 | 100% | |
| Okanogan | |||
(Prefers Democratic Party) | 6,575 | 39.27% | |
(Prefers G.O.P. Party) | 10,168 | 60.73% | |
| Total Votes | 16,743 | 100% | |
| Pacific | |||
(Prefers Democratic Party) | 5,695 | 52.28% | |
(Prefers G.O.P. Party) | 5,198 | 47.72% | |
| Total Votes | 10,893 | 100% | |
| Pend Oreille | |||
(Prefers Democratic Party) | 2,571 | 39.66% | |
(Prefers G.O.P. Party) | 3,912 | 60.34% | |
| Total Votes | 6,483 | 100% | |
| Pierce | |||
(Prefers Democratic Party) | 166,562 | 51.1% | |
(Prefers G.O.P. Party) | 159,363 | 48.9% | |
| Total Votes | 325,925 | 100% | |
| San Juan | |||
(Prefers Democratic Party) | 7,044 | 67.73% | |
(Prefers G.O.P. Party) | 3,356 | 32.27% | |
| Total Votes | 10,400 | 100% | |
| Skagit | |||
(Prefers Democratic Party) | 27,915 | 50.33% | |
(Prefers G.O.P. Party) | 27,545 | 49.67% | |
| Total Votes | 55,460 | 100% | |
| Skamania | |||
(Prefers Democratic Party) | 2,564 | 47.68% | |
(Prefers G.O.P. Party) | 2,813 | 52.32% | |
| Total Votes | 5,377 | 100% | |
| Snohomish | |||
(Prefers Democratic Party) | 167,175 | 52.67% | |
(Prefers G.O.P. Party) | 150,205 | 47.33% | |
| Total Votes | 317,380 | 100% | |
| Spokane | |||
(Prefers Democratic Party) | 104,369 | 48.11% | |
(Prefers G.O.P. Party) | 112,570 | 51.89% | |
| Total Votes | 216,939 | 100% | |
| Stevens | |||
(Prefers Democratic Party) | 7,771 | 35.02% | |
(Prefers G.O.P. Party) | 14,418 | 64.98% | |
| Total Votes | 22,189 | 100% | |
| Thurston | |||
(Prefers Democratic Party) | 72,652 | 57.88% | |
(Prefers G.O.P. Party) | 52,880 | 42.12% | |
| Total Votes | 125,532 | 100% | |
| Wahkiakum | |||
(Prefers Democratic Party) | 960 | 41.92% | |
(Prefers G.O.P. Party) | 1,330 | 58.08% | |
| Total Votes | 2,290 | 100% | |
| Walla Walla | |||
(Prefers Democratic Party) | 9,405 | 38.32% | |
(Prefers G.O.P. Party) | 15,137 | 61.68% | |
| Total Votes | 24,542 | 100% | |
| Whatcom | |||
(Prefers Democratic Party) | 54,249 | 54.67% | |
(Prefers G.O.P. Party) | 44,975 | 45.33% | |
| Total Votes | 99,224 | 100% | |
| Whitman | |||
(Prefers Democratic Party) | 8,363 | 48.46% | |
(Prefers G.O.P. Party) | 8,896 | 51.54% | |
| Total Votes | 17,259 | 100% | |
| Yakima | |||
(Prefers Democratic Party) | 30,172 | 39.27% | |
(Prefers G.O.P. Party) | 46,667 | 60.73% | |
| Total Votes | 76,839 | 100% | |