


November 04, 2008 General Election Results
Commissioner of Public Lands - County Results
Last updated on 11/26/2008 9:41 AM
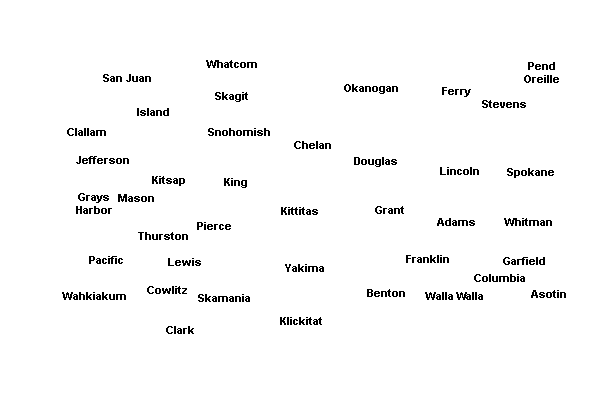
The boxes identify the two candidates receiving the most votes. The map displays the top vote-getter by county, which may include candidates other than the two receiving the most votes overall.
Total
50.55%
Peter J. Goldmark(Prefers Democratic Party)
1,416,904
49.45%
Doug Sutherland(Prefers Republican Party)
1,385,903
Adams County
68.5%
Doug Sutherland3,077
31.5%
Peter J. Goldmark1,415
Asotin County
56.78%
Doug Sutherland5,180
43.22%
Peter J. Goldmark3,943
Benton County
66.96%
Doug Sutherland45,384
33.04%
Peter J. Goldmark22,392
Chelan County
61.24%
Doug Sutherland18,318
38.76%
Peter J. Goldmark11,596
Clallam County
56.12%
Doug Sutherland20,349
43.88%
Peter J. Goldmark15,913
Clark County
52.92%
Doug Sutherland88,956
47.08%
Peter J. Goldmark79,143
Columbia County
68.71%
Doug Sutherland1,423
31.29%
Peter J. Goldmark648
Cowlitz County
52.36%
Doug Sutherland21,964
47.64%
Peter J. Goldmark19,988
Douglas County
62.95%
Doug Sutherland8,942
37.05%
Peter J. Goldmark5,262
Ferry County
57.78%
Doug Sutherland1,908
42.22%
Peter J. Goldmark1,394
Franklin County
65.12%
Doug Sutherland12,157
34.88%
Peter J. Goldmark6,513
Garfield County
72.46%
Doug Sutherland913
27.54%
Peter J. Goldmark347
Grant County
64.28%
Doug Sutherland16,502
35.72%
Peter J. Goldmark9,170
Grays Harbor County
60.53%
Doug Sutherland16,852
39.47%
Peter J. Goldmark10,988
Island County
52.61%
Doug Sutherland20,547
47.39%
Peter J. Goldmark18,511
Jefferson County
58.82%
Peter J. Goldmark10,997
41.18%
Doug Sutherland7,700
King County
61.88%
Peter J. Goldmark511,295
38.12%
Doug Sutherland314,993
Kitsap County
51.46%
Doug Sutherland59,942
48.54%
Peter J. Goldmark56,552
Kittitas County
59.71%
Doug Sutherland9,874
40.29%
Peter J. Goldmark6,663
Klickitat County
55.18%
Doug Sutherland5,208
44.82%
Peter J. Goldmark4,231
Lewis County
67.84%
Doug Sutherland22,365
32.16%
Peter J. Goldmark10,602
Lincoln County
62.36%
Doug Sutherland3,489
37.64%
Peter J. Goldmark2,106
Mason County
56.97%
Doug Sutherland15,407
43.03%
Peter J. Goldmark11,635
Okanogan County
50.26%
Peter J. Goldmark8,112
49.74%
Doug Sutherland8,028
Pacific County
55.04%
Doug Sutherland5,685
44.96%
Peter J. Goldmark4,643
Pend Oreille County
59.14%
Doug Sutherland3,666
40.86%
Peter J. Goldmark2,533
Pierce County
54.79%
Doug Sutherland170,256
45.21%
Peter J. Goldmark140,483
San Juan County
62.71%
Peter J. Goldmark6,110
37.29%
Doug Sutherland3,633
Skagit County
54.01%
Doug Sutherland28,222
45.99%
Peter J. Goldmark24,032
Skamania County
54.13%
Doug Sutherland2,738
45.87%
Peter J. Goldmark2,320
Snohomish County
50.68%
Peter J. Goldmark151,459
49.32%
Doug Sutherland147,375
Spokane County
51.93%
Doug Sutherland106,492
48.07%
Peter J. Goldmark98,569
Stevens County
61.66%
Doug Sutherland13,064
38.34%
Peter J. Goldmark8,123
Thurston County
53.4%
Doug Sutherland63,028
46.6%
Peter J. Goldmark55,008
Wahkiakum County
58.78%
Doug Sutherland1,242
41.22%
Peter J. Goldmark871
Walla Walla County
62.72%
Doug Sutherland14,152
37.28%
Peter J. Goldmark8,412
Whatcom County
51.47%
Peter J. Goldmark47,978
48.53%
Doug Sutherland45,234
Whitman County
52.01%
Doug Sutherland8,377
47.99%
Peter J. Goldmark7,731
Yakima County
59.69%
Doug Sutherland43,261
40.31%
Peter J. Goldmark29,216


| Commissioner of Public Lands | |||
| County | Candidate | Vote | Vote % |
|---|---|---|---|
| Adams | |||
(Prefers Republican Party) | 3,077 | 68.5% | |
(Prefers Democratic Party) | 1,415 | 31.5% | |
| Total Votes | 4,492 | 100% | |
| Asotin | |||
(Prefers Republican Party) | 5,180 | 56.78% | |
(Prefers Democratic Party) | 3,943 | 43.22% | |
| Total Votes | 9,123 | 100% | |
| Benton | |||
(Prefers Republican Party) | 45,384 | 66.96% | |
(Prefers Democratic Party) | 22,392 | 33.04% | |
| Total Votes | 67,776 | 100% | |
| Chelan | |||
(Prefers Republican Party) | 18,318 | 61.24% | |
(Prefers Democratic Party) | 11,596 | 38.76% | |
| Total Votes | 29,914 | 100% | |
| Clallam | |||
(Prefers Republican Party) | 20,349 | 56.12% | |
(Prefers Democratic Party) | 15,913 | 43.88% | |
| Total Votes | 36,262 | 100% | |
| Clark | |||
(Prefers Republican Party) | 88,956 | 52.92% | |
(Prefers Democratic Party) | 79,143 | 47.08% | |
| Total Votes | 168,099 | 100% | |
| Columbia | |||
(Prefers Republican Party) | 1,423 | 68.71% | |
(Prefers Democratic Party) | 648 | 31.29% | |
| Total Votes | 2,071 | 100% | |
| Cowlitz | |||
(Prefers Republican Party) | 21,964 | 52.36% | |
(Prefers Democratic Party) | 19,988 | 47.64% | |
| Total Votes | 41,952 | 100% | |
| Douglas | |||
(Prefers Republican Party) | 8,942 | 62.95% | |
(Prefers Democratic Party) | 5,262 | 37.05% | |
| Total Votes | 14,204 | 100% | |
| Ferry | |||
(Prefers Republican Party) | 1,908 | 57.78% | |
(Prefers Democratic Party) | 1,394 | 42.22% | |
| Total Votes | 3,302 | 100% | |
| Franklin | |||
(Prefers Republican Party) | 12,157 | 65.12% | |
(Prefers Democratic Party) | 6,513 | 34.88% | |
| Total Votes | 18,670 | 100% | |
| Garfield | |||
(Prefers Republican Party) | 913 | 72.46% | |
(Prefers Democratic Party) | 347 | 27.54% | |
| Total Votes | 1,260 | 100% | |
| Grant | |||
(Prefers Republican Party) | 16,502 | 64.28% | |
(Prefers Democratic Party) | 9,170 | 35.72% | |
| Total Votes | 25,672 | 100% | |
| Grays Harbor | |||
(Prefers Republican Party) | 16,852 | 60.53% | |
(Prefers Democratic Party) | 10,988 | 39.47% | |
| Total Votes | 27,840 | 100% | |
| Island | |||
(Prefers Republican Party) | 20,547 | 52.61% | |
(Prefers Democratic Party) | 18,511 | 47.39% | |
| Total Votes | 39,058 | 100% | |
| Jefferson | |||
(Prefers Republican Party) | 7,700 | 41.18% | |
(Prefers Democratic Party) | 10,997 | 58.82% | |
| Total Votes | 18,697 | 100% | |
| King | |||
(Prefers Republican Party) | 314,993 | 38.12% | |
(Prefers Democratic Party) | 511,295 | 61.88% | |
| Total Votes | 826,288 | 100% | |
| Kitsap | |||
(Prefers Republican Party) | 59,942 | 51.46% | |
(Prefers Democratic Party) | 56,552 | 48.54% | |
| Total Votes | 116,494 | 100% | |
| Kittitas | |||
(Prefers Republican Party) | 9,874 | 59.71% | |
(Prefers Democratic Party) | 6,663 | 40.29% | |
| Total Votes | 16,537 | 100% | |
| Klickitat | |||
(Prefers Republican Party) | 5,208 | 55.18% | |
(Prefers Democratic Party) | 4,231 | 44.82% | |
| Total Votes | 9,439 | 100% | |
| Lewis | |||
(Prefers Republican Party) | 22,365 | 67.84% | |
(Prefers Democratic Party) | 10,602 | 32.16% | |
| Total Votes | 32,967 | 100% | |
| Lincoln | |||
(Prefers Republican Party) | 3,489 | 62.36% | |
(Prefers Democratic Party) | 2,106 | 37.64% | |
| Total Votes | 5,595 | 100% | |
| Mason | |||
(Prefers Republican Party) | 15,407 | 56.97% | |
(Prefers Democratic Party) | 11,635 | 43.03% | |
| Total Votes | 27,042 | 100% | |
| Okanogan | |||
(Prefers Republican Party) | 8,028 | 49.74% | |
(Prefers Democratic Party) | 8,112 | 50.26% | |
| Total Votes | 16,140 | 100% | |
| Pacific | |||
(Prefers Republican Party) | 5,685 | 55.04% | |
(Prefers Democratic Party) | 4,643 | 44.96% | |
| Total Votes | 10,328 | 100% | |
| Pend Oreille | |||
(Prefers Republican Party) | 3,666 | 59.14% | |
(Prefers Democratic Party) | 2,533 | 40.86% | |
| Total Votes | 6,199 | 100% | |
| Pierce | |||
(Prefers Republican Party) | 170,256 | 54.79% | |
(Prefers Democratic Party) | 140,483 | 45.21% | |
| Total Votes | 310,739 | 100% | |
| San Juan | |||
(Prefers Republican Party) | 3,633 | 37.29% | |
(Prefers Democratic Party) | 6,110 | 62.71% | |
| Total Votes | 9,743 | 100% | |
| Skagit | |||
(Prefers Republican Party) | 28,222 | 54.01% | |
(Prefers Democratic Party) | 24,032 | 45.99% | |
| Total Votes | 52,254 | 100% | |
| Skamania | |||
(Prefers Republican Party) | 2,738 | 54.13% | |
(Prefers Democratic Party) | 2,320 | 45.87% | |
| Total Votes | 5,058 | 100% | |
| Snohomish | |||
(Prefers Republican Party) | 147,375 | 49.32% | |
(Prefers Democratic Party) | 151,459 | 50.68% | |
| Total Votes | 298,834 | 100% | |
| Spokane | |||
(Prefers Republican Party) | 106,492 | 51.93% | |
(Prefers Democratic Party) | 98,569 | 48.07% | |
| Total Votes | 205,061 | 100% | |
| Stevens | |||
(Prefers Republican Party) | 13,064 | 61.66% | |
(Prefers Democratic Party) | 8,123 | 38.34% | |
| Total Votes | 21,187 | 100% | |
| Thurston | |||
(Prefers Republican Party) | 63,028 | 53.4% | |
(Prefers Democratic Party) | 55,008 | 46.6% | |
| Total Votes | 118,036 | 100% | |
| Wahkiakum | |||
(Prefers Republican Party) | 1,242 | 58.78% | |
(Prefers Democratic Party) | 871 | 41.22% | |
| Total Votes | 2,113 | 100% | |
| Walla Walla | |||
(Prefers Republican Party) | 14,152 | 62.72% | |
(Prefers Democratic Party) | 8,412 | 37.28% | |
| Total Votes | 22,564 | 100% | |
| Whatcom | |||
(Prefers Republican Party) | 45,234 | 48.53% | |
(Prefers Democratic Party) | 47,978 | 51.47% | |
| Total Votes | 93,212 | 100% | |
| Whitman | |||
(Prefers Republican Party) | 8,377 | 52.01% | |
(Prefers Democratic Party) | 7,731 | 47.99% | |
| Total Votes | 16,108 | 100% | |
| Yakima | |||
(Prefers Republican Party) | 43,261 | 59.69% | |
(Prefers Democratic Party) | 29,216 | 40.31% | |
| Total Votes | 72,477 | 100% | |