


August 19, 2008 Primary Results
U.S. Congressional District 2 - Representative - County Results
Last updated on 09/04/2008 6:59 PM
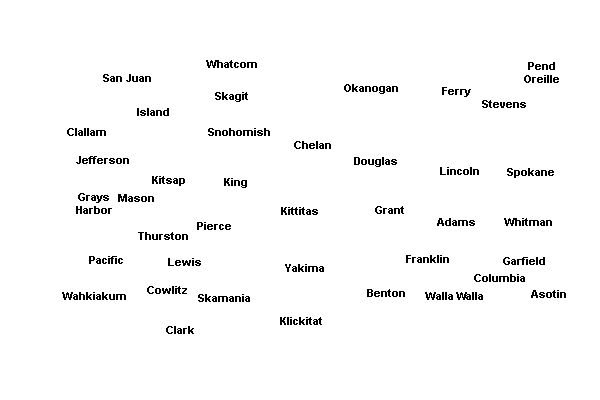
The boxes identify the two candidates receiving the most votes. The map displays the top vote-getter by county, which may include candidates other than the two receiving the most votes overall.The two candidates receiving the most votes overall will appear in the General Election.
Total
54.33%
Rick Larsen(Prefers Democratic Party)
98,304
37.69%
Rick Bart(Prefers Republican Party)
68,189
Island County
56.86%
Rick Larsen14,077
36.65%
Rick Bart9,072
King County
55.15%
Rick Larsen75
35.29%
Rick Bart48
San Juan County
62.76%
Rick Larsen4,296
27.9%
Rick Bart1,910
Skagit County
57.11%
Rick Larsen17,472
35.62%
Rick Bart10,897
Snohomish County
49.98%
Rick Larsen35,117
41.99%
Rick Bart29,504
Whatcom County
56.4%
Rick Larsen27,267
34.66%
Rick Bart16,758


| U.S. Congressional District 2 - Representative | |||
| County | Candidate | Vote | Vote % |
|---|---|---|---|
| Island | |||
(Prefers Democratic Party) | 960 | 3.88% | |
(Prefers Democratic Party) | 647 | 2.61% | |
(Prefers Republican Party) | 9,072 | 36.65% | |
(Prefers Democratic Party) | 14,077 | 56.86% | |
| Total Votes | 24,756 | 100% | |
| King | |||
(Prefers Democratic Party) | 4 | 2.94% | |
(Prefers Democratic Party) | 9 | 6.62% | |
(Prefers Republican Party) | 48 | 35.29% | |
(Prefers Democratic Party) | 75 | 55.15% | |
| Total Votes | 136 | 100% | |
| San Juan | |||
(Prefers Democratic Party) | 315 | 4.6% | |
(Prefers Democratic Party) | 324 | 4.73% | |
(Prefers Republican Party) | 1,910 | 27.9% | |
(Prefers Democratic Party) | 4,296 | 62.76% | |
| Total Votes | 6,845 | 100% | |
| Skagit | |||
(Prefers Democratic Party) | 1,207 | 3.95% | |
(Prefers Democratic Party) | 1,017 | 3.32% | |
(Prefers Republican Party) | 10,897 | 35.62% | |
(Prefers Democratic Party) | 17,472 | 57.11% | |
| Total Votes | 30,593 | 100% | |
| Snohomish | |||
(Prefers Democratic Party) | 3,703 | 5.27% | |
(Prefers Democratic Party) | 1,941 | 2.76% | |
(Prefers Republican Party) | 29,504 | 41.99% | |
(Prefers Democratic Party) | 35,117 | 49.98% | |
| Total Votes | 70,265 | 100% | |
| Whatcom | |||
(Prefers Democratic Party) | 2,668 | 5.52% | |
(Prefers Democratic Party) | 1,652 | 3.42% | |
(Prefers Republican Party) | 16,758 | 34.66% | |
(Prefers Democratic Party) | 27,267 | 56.4% | |
| Total Votes | 48,345 | 100% | |