


August 19, 2008 Primary Results
Legislative District 9 - State Representative Pos. 1 - County Results
Last updated on 09/04/2008 6:59 PM
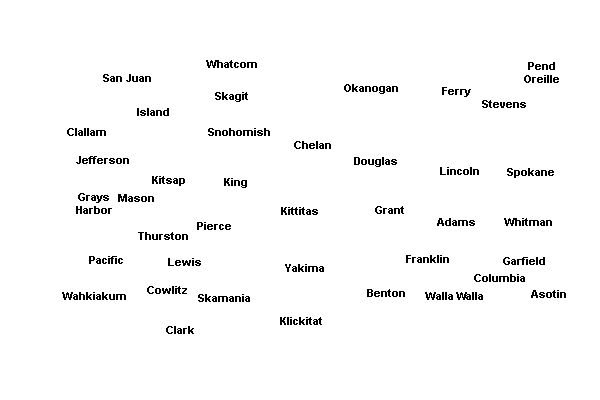
The boxes identify the two candidates receiving the most votes. The map displays the top vote-getter by county, which may include candidates other than the two receiving the most votes overall.The two candidates receiving the most votes overall will appear in the General Election.
Total
66.16%
Steve Hailey(Prefers G.O.P. Party)
17,657
33.84%
Kenneth E. Caylor(Prefers Democratic Party)
9,030
Adams County
73.33%
Steve Hailey1,892
26.67%
Kenneth E. Caylor688
Asotin County
59.24%
Steve Hailey3,068
40.76%
Kenneth E. Caylor2,111
Franklin County
89.91%
Steve Hailey1,710
10.09%
Kenneth E. Caylor192
Garfield County
76.27%
Steve Hailey572
23.73%
Kenneth E. Caylor178
Spokane County
64.45%
Steve Hailey5,332
35.55%
Kenneth E. Caylor2,941
Whitman County
63.51%
Steve Hailey5,083
36.49%
Kenneth E. Caylor2,920


| Legislative District 9 - State Representative Pos. 1 | |||
| County | Candidate | Vote | Vote % |
|---|---|---|---|
| Adams | |||
(Prefers Democratic Party) | 688 | 26.67% | |
(Prefers G.O.P. Party) | 1,892 | 73.33% | |
| Total Votes | 2,580 | 100% | |
| Asotin | |||
(Prefers Democratic Party) | 2,111 | 40.76% | |
(Prefers G.O.P. Party) | 3,068 | 59.24% | |
| Total Votes | 5,179 | 100% | |
| Franklin | |||
(Prefers Democratic Party) | 192 | 10.09% | |
(Prefers G.O.P. Party) | 1,710 | 89.91% | |
| Total Votes | 1,902 | 100% | |
| Garfield | |||
(Prefers Democratic Party) | 178 | 23.73% | |
(Prefers G.O.P. Party) | 572 | 76.27% | |
| Total Votes | 750 | 100% | |
| Spokane | |||
(Prefers Democratic Party) | 2,941 | 35.55% | |
(Prefers G.O.P. Party) | 5,332 | 64.45% | |
| Total Votes | 8,273 | 100% | |
| Whitman | |||
(Prefers Democratic Party) | 2,920 | 36.49% | |
(Prefers G.O.P. Party) | 5,083 | 63.51% | |
| Total Votes | 8,003 | 100% | |