


August 19, 2008 Primary Results
Insurance Commissioner - County Results
Last updated on 09/04/2008 6:59 PM
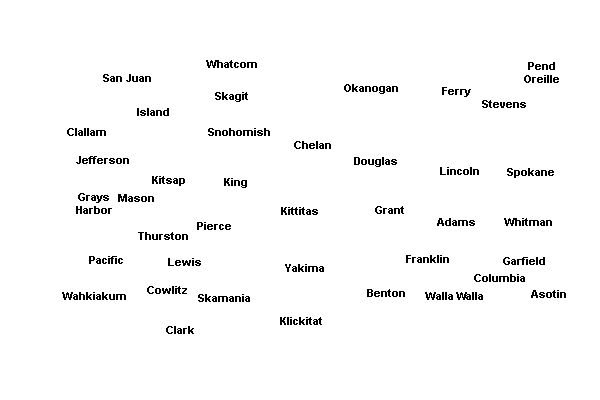
The boxes identify the two candidates receiving the most votes. The map displays the top vote-getter by county, which may include candidates other than the two receiving the most votes overall.The two candidates receiving the most votes overall will appear in the General Election.
Total
53.86%
Mike Kreidler(Prefers Democratic Party)
723,732
36.09%
John R. Adams(Prefers Republican Party)
484,992
Adams County
58.25%
John R. Adams1,422
31.22%
Mike Kreidler762
Asotin County
44.24%
Mike Kreidler2,274
42.76%
John R. Adams2,198
Benton County
51.7%
John R. Adams19,012
35.85%
Mike Kreidler13,184
Chelan County
49.56%
John R. Adams8,091
39.41%
Mike Kreidler6,434
Clallam County
49.72%
Mike Kreidler10,573
39.26%
John R. Adams8,348
Clark County
46.67%
Mike Kreidler33,074
40.61%
John R. Adams28,785
Columbia County
56.6%
John R. Adams780
31.28%
Mike Kreidler431
Cowlitz County
51.64%
Mike Kreidler10,767
35.36%
John R. Adams7,372
Douglas County
51.33%
John R. Adams4,192
37.52%
Mike Kreidler3,064
Ferry County
45.73%
John R. Adams872
39.49%
Mike Kreidler753
Franklin County
52.54%
John R. Adams5,607
36.11%
Mike Kreidler3,853
Garfield County
53.74%
John R. Adams388
36.15%
Mike Kreidler261
Grant County
52.84%
John R. Adams7,613
34.41%
Mike Kreidler4,957
Grays Harbor County
58.59%
Mike Kreidler9,673
30.84%
John R. Adams5,091
Island County
51.57%
Mike Kreidler12,250
38.26%
John R. Adams9,088
Jefferson County
61.37%
Mike Kreidler7,649
28.03%
John R. Adams3,493
King County
65.7%
Mike Kreidler219,664
26.66%
John R. Adams89,148
Kitsap County
54.07%
Mike Kreidler34,698
36.3%
John R. Adams23,293
Kittitas County
45.06%
John R. Adams4,202
43.51%
Mike Kreidler4,057
Klickitat County
43.74%
Mike Kreidler2,154
41.83%
John R. Adams2,060
Lewis County
47.56%
John R. Adams8,836
40.39%
Mike Kreidler7,504
Lincoln County
50.84%
John R. Adams1,851
36.56%
Mike Kreidler1,331
Mason County
55.3%
Mike Kreidler9,165
33.94%
John R. Adams5,625
Okanogan County
46.93%
John R. Adams3,917
38.74%
Mike Kreidler3,233
Pacific County
55.92%
Mike Kreidler3,586
31.25%
John R. Adams2,004
Pend Oreille County
44.47%
John R. Adams1,635
38.13%
Mike Kreidler1,402
Pierce County
55.16%
Mike Kreidler79,984
36.52%
John R. Adams52,962
San Juan County
59.69%
Mike Kreidler3,768
28.07%
John R. Adams1,772
Skagit County
51.71%
Mike Kreidler15,143
38.08%
John R. Adams11,153
Skamania County
48.3%
Mike Kreidler1,139
39.23%
John R. Adams925
Snohomish County
55.27%
Mike Kreidler77,092
35.13%
John R. Adams49,003
Spokane County
45.34%
Mike Kreidler47,364
40.33%
John R. Adams42,135
Stevens County
48.13%
John R. Adams5,756
33.87%
Mike Kreidler4,050
Thurston County
62.69%
Mike Kreidler39,845
29.4%
John R. Adams18,687
Wahkiakum County
47.37%
Mike Kreidler613
37.09%
John R. Adams480
Walla Walla County
49.49%
John R. Adams6,302
38.58%
Mike Kreidler4,913
Whatcom County
52.39%
Mike Kreidler24,093
38.06%
John R. Adams17,504
Whitman County
44.22%
John R. Adams3,458
43.12%
Mike Kreidler3,372
Yakima County
49.91%
John R. Adams19,932
39.07%
Mike Kreidler15,603


| Insurance Commissioner | |||
| County | Candidate | Vote | Vote % |
|---|---|---|---|
| Adams | |||
(States No Party Preference) | 257 | 10.53% | |
(Prefers Republican Party) | 1,422 | 58.25% | |
(Prefers Democratic Party) | 762 | 31.22% | |
| Total Votes | 2,441 | 100% | |
| Asotin | |||
(States No Party Preference) | 668 | 13% | |
(Prefers Republican Party) | 2,198 | 42.76% | |
(Prefers Democratic Party) | 2,274 | 44.24% | |
| Total Votes | 5,140 | 100% | |
| Benton | |||
(States No Party Preference) | 4,578 | 12.45% | |
(Prefers Republican Party) | 19,012 | 51.7% | |
(Prefers Democratic Party) | 13,184 | 35.85% | |
| Total Votes | 36,774 | 100% | |
| Chelan | |||
(States No Party Preference) | 1,801 | 11.03% | |
(Prefers Republican Party) | 8,091 | 49.56% | |
(Prefers Democratic Party) | 6,434 | 39.41% | |
| Total Votes | 16,326 | 100% | |
| Clallam | |||
(States No Party Preference) | 2,344 | 11.02% | |
(Prefers Republican Party) | 8,348 | 39.26% | |
(Prefers Democratic Party) | 10,573 | 49.72% | |
| Total Votes | 21,265 | 100% | |
| Clark | |||
(States No Party Preference) | 9,014 | 12.72% | |
(Prefers Republican Party) | 28,785 | 40.61% | |
(Prefers Democratic Party) | 33,074 | 46.67% | |
| Total Votes | 70,873 | 100% | |
| Columbia | |||
(States No Party Preference) | 167 | 12.12% | |
(Prefers Republican Party) | 780 | 56.6% | |
(Prefers Democratic Party) | 431 | 31.28% | |
| Total Votes | 1,378 | 100% | |
| Cowlitz | |||
(States No Party Preference) | 2,710 | 13% | |
(Prefers Republican Party) | 7,372 | 35.36% | |
(Prefers Democratic Party) | 10,767 | 51.64% | |
| Total Votes | 20,849 | 100% | |
| Douglas | |||
(States No Party Preference) | 911 | 11.15% | |
(Prefers Republican Party) | 4,192 | 51.33% | |
(Prefers Democratic Party) | 3,064 | 37.52% | |
| Total Votes | 8,167 | 100% | |
| Ferry | |||
(States No Party Preference) | 282 | 14.79% | |
(Prefers Republican Party) | 872 | 45.73% | |
(Prefers Democratic Party) | 753 | 39.49% | |
| Total Votes | 1,907 | 100% | |
| Franklin | |||
(States No Party Preference) | 1,211 | 11.35% | |
(Prefers Republican Party) | 5,607 | 52.54% | |
(Prefers Democratic Party) | 3,853 | 36.11% | |
| Total Votes | 10,671 | 100% | |
| Garfield | |||
(States No Party Preference) | 73 | 10.11% | |
(Prefers Republican Party) | 388 | 53.74% | |
(Prefers Democratic Party) | 261 | 36.15% | |
| Total Votes | 722 | 100% | |
| Grant | |||
(States No Party Preference) | 1,837 | 12.75% | |
(Prefers Republican Party) | 7,613 | 52.84% | |
(Prefers Democratic Party) | 4,957 | 34.41% | |
| Total Votes | 14,407 | 100% | |
| Grays Harbor | |||
(States No Party Preference) | 1,746 | 10.58% | |
(Prefers Republican Party) | 5,091 | 30.84% | |
(Prefers Democratic Party) | 9,673 | 58.59% | |
| Total Votes | 16,510 | 100% | |
| Island | |||
(States No Party Preference) | 2,418 | 10.18% | |
(Prefers Republican Party) | 9,088 | 38.26% | |
(Prefers Democratic Party) | 12,250 | 51.57% | |
| Total Votes | 23,756 | 100% | |
| Jefferson | |||
(States No Party Preference) | 1,321 | 10.6% | |
(Prefers Republican Party) | 3,493 | 28.03% | |
(Prefers Democratic Party) | 7,649 | 61.37% | |
| Total Votes | 12,463 | 100% | |
| King | |||
(States No Party Preference) | 25,522 | 7.63% | |
(Prefers Republican Party) | 89,148 | 26.66% | |
(Prefers Democratic Party) | 219,664 | 65.7% | |
| Total Votes | 334,334 | 100% | |
| Kitsap | |||
(States No Party Preference) | 6,177 | 9.63% | |
(Prefers Republican Party) | 23,293 | 36.3% | |
(Prefers Democratic Party) | 34,698 | 54.07% | |
| Total Votes | 64,168 | 100% | |
| Kittitas | |||
(States No Party Preference) | 1,066 | 11.43% | |
(Prefers Republican Party) | 4,202 | 45.06% | |
(Prefers Democratic Party) | 4,057 | 43.51% | |
| Total Votes | 9,325 | 100% | |
| Klickitat | |||
(States No Party Preference) | 711 | 14.44% | |
(Prefers Republican Party) | 2,060 | 41.83% | |
(Prefers Democratic Party) | 2,154 | 43.74% | |
| Total Votes | 4,925 | 100% | |
| Lewis | |||
(States No Party Preference) | 2,238 | 12.05% | |
(Prefers Republican Party) | 8,836 | 47.56% | |
(Prefers Democratic Party) | 7,504 | 40.39% | |
| Total Votes | 18,578 | 100% | |
| Lincoln | |||
(States No Party Preference) | 459 | 12.61% | |
(Prefers Republican Party) | 1,851 | 50.84% | |
(Prefers Democratic Party) | 1,331 | 36.56% | |
| Total Votes | 3,641 | 100% | |
| Mason | |||
(States No Party Preference) | 1,783 | 10.76% | |
(Prefers Republican Party) | 5,625 | 33.94% | |
(Prefers Democratic Party) | 9,165 | 55.3% | |
| Total Votes | 16,573 | 100% | |
| Okanogan | |||
(States No Party Preference) | 1,196 | 14.33% | |
(Prefers Republican Party) | 3,917 | 46.93% | |
(Prefers Democratic Party) | 3,233 | 38.74% | |
| Total Votes | 8,346 | 100% | |
| Pacific | |||
(States No Party Preference) | 823 | 12.83% | |
(Prefers Republican Party) | 2,004 | 31.25% | |
(Prefers Democratic Party) | 3,586 | 55.92% | |
| Total Votes | 6,413 | 100% | |
| Pend Oreille | |||
(States No Party Preference) | 640 | 17.41% | |
(Prefers Republican Party) | 1,635 | 44.47% | |
(Prefers Democratic Party) | 1,402 | 38.13% | |
| Total Votes | 3,677 | 100% | |
| Pierce | |||
(States No Party Preference) | 12,067 | 8.32% | |
(Prefers Republican Party) | 52,962 | 36.52% | |
(Prefers Democratic Party) | 79,984 | 55.16% | |
| Total Votes | 145,013 | 100% | |
| San Juan | |||
(States No Party Preference) | 773 | 12.24% | |
(Prefers Republican Party) | 1,772 | 28.07% | |
(Prefers Democratic Party) | 3,768 | 59.69% | |
| Total Votes | 6,313 | 100% | |
| Skagit | |||
(States No Party Preference) | 2,990 | 10.21% | |
(Prefers Republican Party) | 11,153 | 38.08% | |
(Prefers Democratic Party) | 15,143 | 51.71% | |
| Total Votes | 29,286 | 100% | |
| Skamania | |||
(States No Party Preference) | 294 | 12.47% | |
(Prefers Republican Party) | 925 | 39.23% | |
(Prefers Democratic Party) | 1,139 | 48.3% | |
| Total Votes | 2,358 | 100% | |
| Snohomish | |||
(States No Party Preference) | 13,398 | 9.6% | |
(Prefers Republican Party) | 49,003 | 35.13% | |
(Prefers Democratic Party) | 77,092 | 55.27% | |
| Total Votes | 139,493 | 100% | |
| Spokane | |||
(States No Party Preference) | 14,964 | 14.32% | |
(Prefers Republican Party) | 42,135 | 40.33% | |
(Prefers Democratic Party) | 47,364 | 45.34% | |
| Total Votes | 104,463 | 100% | |
| Stevens | |||
(States No Party Preference) | 2,153 | 18% | |
(Prefers Republican Party) | 5,756 | 48.13% | |
(Prefers Democratic Party) | 4,050 | 33.87% | |
| Total Votes | 11,959 | 100% | |
| Thurston | |||
(States No Party Preference) | 5,026 | 7.91% | |
(Prefers Republican Party) | 18,687 | 29.4% | |
(Prefers Democratic Party) | 39,845 | 62.69% | |
| Total Votes | 63,558 | 100% | |
| Wahkiakum | |||
(States No Party Preference) | 201 | 15.53% | |
(Prefers Republican Party) | 480 | 37.09% | |
(Prefers Democratic Party) | 613 | 47.37% | |
| Total Votes | 1,294 | 100% | |
| Walla Walla | |||
(States No Party Preference) | 1,518 | 11.92% | |
(Prefers Republican Party) | 6,302 | 49.49% | |
(Prefers Democratic Party) | 4,913 | 38.58% | |
| Total Votes | 12,733 | 100% | |
| Whatcom | |||
(States No Party Preference) | 4,389 | 9.54% | |
(Prefers Republican Party) | 17,504 | 38.06% | |
(Prefers Democratic Party) | 24,093 | 52.39% | |
| Total Votes | 45,986 | 100% | |
| Whitman | |||
(States No Party Preference) | 990 | 12.66% | |
(Prefers Republican Party) | 3,458 | 44.22% | |
(Prefers Democratic Party) | 3,372 | 43.12% | |
| Total Votes | 7,820 | 100% | |
| Yakima | |||
(States No Party Preference) | 4,397 | 11.01% | |
(Prefers Republican Party) | 19,932 | 49.91% | |
(Prefers Democratic Party) | 15,603 | 39.07% | |
| Total Votes | 39,932 | 100% | |