


August 19, 2008 Primary Results
Commissioner of Public Lands - County Results
Last updated on 09/04/2008 6:59 PM
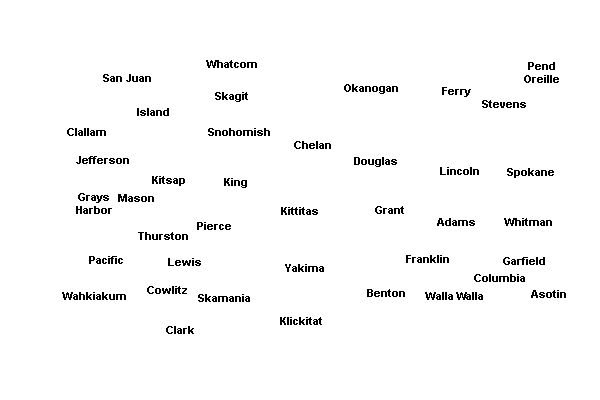
The boxes identify the two candidates receiving the most votes. The map displays the top vote-getter by county, which may include candidates other than the two receiving the most votes overall.The two candidates receiving the most votes overall will appear in the General Election.
Total
51.13%
Doug Sutherland(Prefers Republican Party)
691,145
48.87%
Peter J. Goldmark(Prefers Democratic Party)
660,714
Adams County
68.33%
Doug Sutherland1,709
31.67%
Peter J. Goldmark792
Asotin County
55.38%
Doug Sutherland2,906
44.62%
Peter J. Goldmark2,341
Benton County
66.4%
Doug Sutherland24,980
33.6%
Peter J. Goldmark12,638
Chelan County
61.22%
Doug Sutherland10,240
38.78%
Peter J. Goldmark6,487
Clallam County
55.33%
Doug Sutherland11,969
44.67%
Peter J. Goldmark9,662
Clark County
53.58%
Doug Sutherland38,475
46.42%
Peter J. Goldmark33,327
Columbia County
68.84%
Doug Sutherland1,012
31.16%
Peter J. Goldmark458
Cowlitz County
50.71%
Peter J. Goldmark10,845
49.29%
Doug Sutherland10,541
Douglas County
62.18%
Doug Sutherland5,159
37.82%
Peter J. Goldmark3,138
Ferry County
58.27%
Doug Sutherland1,180
41.73%
Peter J. Goldmark845
Franklin County
65.77%
Doug Sutherland7,104
34.23%
Peter J. Goldmark3,698
Garfield County
67.78%
Doug Sutherland507
32.22%
Peter J. Goldmark241
Grant County
63.38%
Doug Sutherland9,284
36.62%
Peter J. Goldmark5,364
Grays Harbor County
54.44%
Doug Sutherland9,242
45.56%
Peter J. Goldmark7,733
Island County
52.1%
Doug Sutherland12,351
47.9%
Peter J. Goldmark11,356
Jefferson County
59.42%
Peter J. Goldmark7,436
40.58%
Doug Sutherland5,079
King County
58.77%
Peter J. Goldmark196,000
41.23%
Doug Sutherland137,487
Kitsap County
51.03%
Doug Sutherland32,373
48.97%
Peter J. Goldmark31,060
Kittitas County
60.96%
Doug Sutherland5,828
39.04%
Peter J. Goldmark3,733
Klickitat County
55.81%
Doug Sutherland2,878
44.19%
Peter J. Goldmark2,279
Lewis County
66.1%
Doug Sutherland12,539
33.9%
Peter J. Goldmark6,430
Lincoln County
60.59%
Doug Sutherland2,291
39.41%
Peter J. Goldmark1,490
Mason County
55.86%
Doug Sutherland9,289
44.14%
Peter J. Goldmark7,340
Okanogan County
51.29%
Doug Sutherland4,584
48.71%
Peter J. Goldmark4,353
Pacific County
50.61%
Doug Sutherland3,367
49.39%
Peter J. Goldmark3,286
Pend Oreille County
57.69%
Doug Sutherland2,158
42.31%
Peter J. Goldmark1,583
Pierce County
55.61%
Doug Sutherland80,609
44.39%
Peter J. Goldmark64,349
San Juan County
61.25%
Peter J. Goldmark4,011
38.75%
Doug Sutherland2,538
Skagit County
53.3%
Doug Sutherland15,698
46.7%
Peter J. Goldmark13,752
Skamania County
52.67%
Doug Sutherland1,264
47.33%
Peter J. Goldmark1,136
Snohomish County
50.23%
Peter J. Goldmark69,864
49.77%
Doug Sutherland69,230
Spokane County
51.39%
Doug Sutherland54,445
48.61%
Peter J. Goldmark51,495
Stevens County
62.31%
Doug Sutherland7,737
37.69%
Peter J. Goldmark4,679
Thurston County
52.29%
Doug Sutherland33,195
47.71%
Peter J. Goldmark30,286
Wahkiakum County
58.08%
Doug Sutherland787
41.92%
Peter J. Goldmark568
Walla Walla County
62.07%
Doug Sutherland8,196
37.93%
Peter J. Goldmark5,009
Whatcom County
50.05%
Peter J. Goldmark23,349
49.95%
Doug Sutherland23,305
Whitman County
52.62%
Doug Sutherland4,231
47.38%
Peter J. Goldmark3,810
Yakima County
63.65%
Doug Sutherland25,378
36.35%
Peter J. Goldmark14,491


| Commissioner of Public Lands | |||
| County | Candidate | Vote | Vote % |
|---|---|---|---|
| Adams | |||
(Prefers Republican Party) | 1,709 | 68.33% | |
(Prefers Democratic Party) | 792 | 31.67% | |
| Total Votes | 2,501 | 100% | |
| Asotin | |||
(Prefers Republican Party) | 2,906 | 55.38% | |
(Prefers Democratic Party) | 2,341 | 44.62% | |
| Total Votes | 5,247 | 100% | |
| Benton | |||
(Prefers Republican Party) | 24,980 | 66.4% | |
(Prefers Democratic Party) | 12,638 | 33.6% | |
| Total Votes | 37,618 | 100% | |
| Chelan | |||
(Prefers Republican Party) | 10,240 | 61.22% | |
(Prefers Democratic Party) | 6,487 | 38.78% | |
| Total Votes | 16,727 | 100% | |
| Clallam | |||
(Prefers Republican Party) | 11,969 | 55.33% | |
(Prefers Democratic Party) | 9,662 | 44.67% | |
| Total Votes | 21,631 | 100% | |
| Clark | |||
(Prefers Republican Party) | 38,475 | 53.58% | |
(Prefers Democratic Party) | 33,327 | 46.42% | |
| Total Votes | 71,802 | 100% | |
| Columbia | |||
(Prefers Republican Party) | 1,012 | 68.84% | |
(Prefers Democratic Party) | 458 | 31.16% | |
| Total Votes | 1,470 | 100% | |
| Cowlitz | |||
(Prefers Republican Party) | 10,541 | 49.29% | |
(Prefers Democratic Party) | 10,845 | 50.71% | |
| Total Votes | 21,386 | 100% | |
| Douglas | |||
(Prefers Republican Party) | 5,159 | 62.18% | |
(Prefers Democratic Party) | 3,138 | 37.82% | |
| Total Votes | 8,297 | 100% | |
| Ferry | |||
(Prefers Republican Party) | 1,180 | 58.27% | |
(Prefers Democratic Party) | 845 | 41.73% | |
| Total Votes | 2,025 | 100% | |
| Franklin | |||
(Prefers Republican Party) | 7,104 | 65.77% | |
(Prefers Democratic Party) | 3,698 | 34.23% | |
| Total Votes | 10,802 | 100% | |
| Garfield | |||
(Prefers Republican Party) | 507 | 67.78% | |
(Prefers Democratic Party) | 241 | 32.22% | |
| Total Votes | 748 | 100% | |
| Grant | |||
(Prefers Republican Party) | 9,284 | 63.38% | |
(Prefers Democratic Party) | 5,364 | 36.62% | |
| Total Votes | 14,648 | 100% | |
| Grays Harbor | |||
(Prefers Republican Party) | 9,242 | 54.44% | |
(Prefers Democratic Party) | 7,733 | 45.56% | |
| Total Votes | 16,975 | 100% | |
| Island | |||
(Prefers Republican Party) | 12,351 | 52.1% | |
(Prefers Democratic Party) | 11,356 | 47.9% | |
| Total Votes | 23,707 | 100% | |
| Jefferson | |||
(Prefers Republican Party) | 5,079 | 40.58% | |
(Prefers Democratic Party) | 7,436 | 59.42% | |
| Total Votes | 12,515 | 100% | |
| King | |||
(Prefers Republican Party) | 137,487 | 41.23% | |
(Prefers Democratic Party) | 196,000 | 58.77% | |
| Total Votes | 333,487 | 100% | |
| Kitsap | |||
(Prefers Republican Party) | 32,373 | 51.03% | |
(Prefers Democratic Party) | 31,060 | 48.97% | |
| Total Votes | 63,433 | 100% | |
| Kittitas | |||
(Prefers Republican Party) | 5,828 | 60.96% | |
(Prefers Democratic Party) | 3,733 | 39.04% | |
| Total Votes | 9,561 | 100% | |
| Klickitat | |||
(Prefers Republican Party) | 2,878 | 55.81% | |
(Prefers Democratic Party) | 2,279 | 44.19% | |
| Total Votes | 5,157 | 100% | |
| Lewis | |||
(Prefers Republican Party) | 12,539 | 66.1% | |
(Prefers Democratic Party) | 6,430 | 33.9% | |
| Total Votes | 18,969 | 100% | |
| Lincoln | |||
(Prefers Republican Party) | 2,291 | 60.59% | |
(Prefers Democratic Party) | 1,490 | 39.41% | |
| Total Votes | 3,781 | 100% | |
| Mason | |||
(Prefers Republican Party) | 9,289 | 55.86% | |
(Prefers Democratic Party) | 7,340 | 44.14% | |
| Total Votes | 16,629 | 100% | |
| Okanogan | |||
(Prefers Republican Party) | 4,584 | 51.29% | |
(Prefers Democratic Party) | 4,353 | 48.71% | |
| Total Votes | 8,937 | 100% | |
| Pacific | |||
(Prefers Republican Party) | 3,367 | 50.61% | |
(Prefers Democratic Party) | 3,286 | 49.39% | |
| Total Votes | 6,653 | 100% | |
| Pend Oreille | |||
(Prefers Republican Party) | 2,158 | 57.69% | |
(Prefers Democratic Party) | 1,583 | 42.31% | |
| Total Votes | 3,741 | 100% | |
| Pierce | |||
(Prefers Republican Party) | 80,609 | 55.61% | |
(Prefers Democratic Party) | 64,349 | 44.39% | |
| Total Votes | 144,958 | 100% | |
| San Juan | |||
(Prefers Republican Party) | 2,538 | 38.75% | |
(Prefers Democratic Party) | 4,011 | 61.25% | |
| Total Votes | 6,549 | 100% | |
| Skagit | |||
(Prefers Republican Party) | 15,698 | 53.3% | |
(Prefers Democratic Party) | 13,752 | 46.7% | |
| Total Votes | 29,450 | 100% | |
| Skamania | |||
(Prefers Republican Party) | 1,264 | 52.67% | |
(Prefers Democratic Party) | 1,136 | 47.33% | |
| Total Votes | 2,400 | 100% | |
| Snohomish | |||
(Prefers Republican Party) | 69,230 | 49.77% | |
(Prefers Democratic Party) | 69,864 | 50.23% | |
| Total Votes | 139,094 | 100% | |
| Spokane | |||
(Prefers Republican Party) | 54,445 | 51.39% | |
(Prefers Democratic Party) | 51,495 | 48.61% | |
| Total Votes | 105,940 | 100% | |
| Stevens | |||
(Prefers Republican Party) | 7,737 | 62.31% | |
(Prefers Democratic Party) | 4,679 | 37.69% | |
| Total Votes | 12,416 | 100% | |
| Thurston | |||
(Prefers Republican Party) | 33,195 | 52.29% | |
(Prefers Democratic Party) | 30,286 | 47.71% | |
| Total Votes | 63,481 | 100% | |
| Wahkiakum | |||
(Prefers Republican Party) | 787 | 58.08% | |
(Prefers Democratic Party) | 568 | 41.92% | |
| Total Votes | 1,355 | 100% | |
| Walla Walla | |||
(Prefers Republican Party) | 8,196 | 62.07% | |
(Prefers Democratic Party) | 5,009 | 37.93% | |
| Total Votes | 13,205 | 100% | |
| Whatcom | |||
(Prefers Republican Party) | 23,305 | 49.95% | |
(Prefers Democratic Party) | 23,349 | 50.05% | |
| Total Votes | 46,654 | 100% | |
| Whitman | |||
(Prefers Republican Party) | 4,231 | 52.62% | |
(Prefers Democratic Party) | 3,810 | 47.38% | |
| Total Votes | 8,041 | 100% | |
| Yakima | |||
(Prefers Republican Party) | 25,378 | 63.65% | |
(Prefers Democratic Party) | 14,491 | 36.35% | |
| Total Votes | 39,869 | 100% | |