


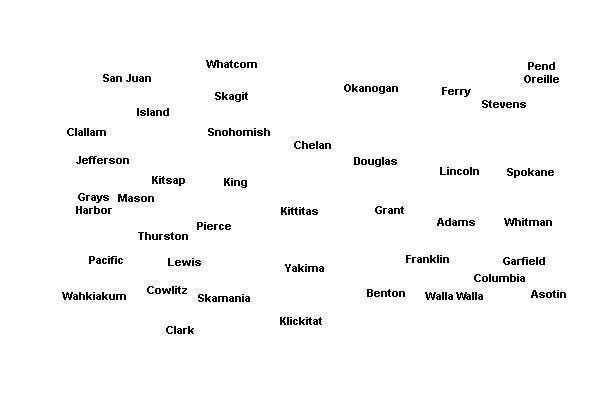
February 19, 2008 Special Election Results
President - Democratic Party - County Results
Last updated on 03/06/2008 10:51 AM
Total
51.22%
Barack Obama354,112
45.67%
Hillary Clinton315,744
Adams County
53.71%
Hillary Clinton543
41.64%
Barack Obama421
Asotin County
48.96%
Hillary Clinton1,336
47.27%
Barack Obama1,290
Benton County
49.7%
Hillary Clinton5,958
46.2%
Barack Obama5,538
Chelan County
54.92%
Barack Obama3,060
42.41%
Hillary Clinton2,363
Clallam County
52.49%
Barack Obama5,248
43.53%
Hillary Clinton4,352
Clark County
50.18%
Hillary Clinton21,374
46.49%
Barack Obama19,801
Columbia County
53.51%
Barack Obama267
39.68%
Hillary Clinton198
Cowlitz County
55.57%
Hillary Clinton6,874
40.83%
Barack Obama5,051
Douglas County
49.24%
Barack Obama1,394
47.33%
Hillary Clinton1,340
Ferry County
50.67%
Barack Obama415
44.2%
Hillary Clinton362
Franklin County
52.46%
Hillary Clinton2,023
42.79%
Barack Obama1,650
Garfield County
49.03%
Hillary Clinton127
42.08%
Barack Obama109
Grant County
52.27%
Hillary Clinton2,615
43.69%
Barack Obama2,186
Grays Harbor County
54.32%
Hillary Clinton4,958
42.13%
Barack Obama3,846
Island County
55.63%
Barack Obama6,604
40.96%
Hillary Clinton4,862
Jefferson County
58.44%
Barack Obama4,180
36.84%
Hillary Clinton2,635
King County
55.56%
Barack Obama100,107
42.02%
Hillary Clinton75,717
Kitsap County
54.43%
Barack Obama16,813
42.24%
Hillary Clinton13,046
Kittitas County
48.88%
Barack Obama2,145
47.47%
Hillary Clinton2,083
Klickitat County
49.22%
Barack Obama1,509
46.09%
Hillary Clinton1,413
Lewis County
48.46%
Hillary Clinton3,563
47.29%
Barack Obama3,477
Lincoln County
48.89%
Barack Obama618
46.28%
Hillary Clinton585
Mason County
49.78%
Hillary Clinton4,470
46.66%
Barack Obama4,190
Okanogan County
55.59%
Barack Obama2,497
39.78%
Hillary Clinton1,787
Pacific County
52.57%
Hillary Clinton2,271
42.8%
Barack Obama1,849
Pend Oreille County
49.26%
Hillary Clinton766
45.98%
Barack Obama715
Pierce County
51.05%
Hillary Clinton41,259
46.18%
Barack Obama37,328
San Juan County
67.38%
Barack Obama2,821
27.59%
Hillary Clinton1,155
Skagit County
56%
Barack Obama7,245
40.2%
Hillary Clinton5,201
Skamania County
49.1%
Barack Obama603
45.52%
Hillary Clinton559
Snohomish County
49.57%
Barack Obama33,958
47.82%
Hillary Clinton32,753
Spokane County
48.76%
Barack Obama28,072
47.93%
Hillary Clinton27,594
Stevens County
52.07%
Barack Obama2,449
44.21%
Hillary Clinton2,079
Thurston County
53.81%
Barack Obama19,631
42.58%
Hillary Clinton15,532
Total County
51.22%
Barack Obama354,112
45.67%
Hillary Clinton315,744
Wahkiakum County
48.78%
Hillary Clinton300
47.97%
Barack Obama295
Walla Walla County
52.02%
Barack Obama3,134
43.83%
Hillary Clinton2,641
Whatcom County
59.41%
Barack Obama14,510
37%
Hillary Clinton9,037
Whitman County
57.94%
Barack Obama2,294
38.95%
Hillary Clinton1,542
Yakima County
53.73%
Hillary Clinton8,471
43.08%
Barack Obama6,792


| President - Democratic Party | |||
| County | Candidate | Vote | Vote % |
|---|---|---|---|
| Adams | |||
Democrat | 5 | 0.49% | |
Democrat | 543 | 53.71% | |
Democrat | 0% | ||
Democrat | 30 | 2.97% | |
Democrat | 2 | 0.2% | |
Democrat | 3 | 0.3% | |
Democrat | 421 | 41.64% | |
Democrat | 7 | 0.69% | |
| Total Votes | 1,011 | 100% | |
| Asotin | |||
Democrat | 7 | 0.26% | |
Democrat | 1,336 | 48.96% | |
Democrat | 5 | 0.18% | |
Democrat | 73 | 2.67% | |
Democrat | 6 | 0.22% | |
Democrat | 8 | 0.29% | |
Democrat | 1,290 | 47.27% | |
Democrat | 4 | 0.15% | |
| Total Votes | 2,729 | 100% | |
| Benton | |||
Democrat | 37 | 0.31% | |
Democrat | 5,958 | 49.7% | |
Democrat | 21 | 0.18% | |
Democrat | 328 | 2.74% | |
Democrat | 14 | 0.12% | |
Democrat | 41 | 0.34% | |
Democrat | 5,538 | 46.2% | |
Democrat | 51 | 0.43% | |
| Total Votes | 11,988 | 100% | |
| Chelan | |||
Democrat | 15 | 0.27% | |
Democrat | 2,363 | 42.41% | |
Democrat | 7 | 0.13% | |
Democrat | 77 | 1.38% | |
Democrat | 6 | 0.11% | |
Democrat | 25 | 0.45% | |
Democrat | 3,060 | 54.92% | |
Democrat | 19 | 0.34% | |
| Total Votes | 5,572 | 100% | |
| Clallam | |||
Democrat | 31 | 0.31% | |
Democrat | 4,352 | 43.53% | |
Democrat | 14 | 0.14% | |
Democrat | 191 | 1.91% | |
Democrat | 23 | 0.23% | |
Democrat | 99 | 0.99% | |
Democrat | 5,248 | 52.49% | |
Democrat | 40 | 0.4% | |
| Total Votes | 9,998 | 100% | |
| Clark | |||
Democrat | 118 | 0.28% | |
Democrat | 21,374 | 50.18% | |
Democrat | 32 | 0.08% | |
Democrat | 896 | 2.1% | |
Democrat | 64 | 0.15% | |
Democrat | 190 | 0.45% | |
Democrat | 19,801 | 46.49% | |
Democrat | 117 | 0.27% | |
| Total Votes | 42,592 | 100% | |
| Columbia | |||
Democrat | 4 | 0.8% | |
Democrat | 198 | 39.68% | |
Democrat | 1 | 0.2% | |
Democrat | 21 | 4.21% | |
Democrat | 2 | 0.4% | |
Democrat | 1 | 0.2% | |
Democrat | 267 | 53.51% | |
Democrat | 5 | 1% | |
| Total Votes | 499 | 100% | |
| Cowlitz | |||
Democrat | 32 | 0.26% | |
Democrat | 6,874 | 55.57% | |
Democrat | 16 | 0.13% | |
Democrat | 286 | 2.31% | |
Democrat | 18 | 0.15% | |
Democrat | 48 | 0.39% | |
Democrat | 5,051 | 40.83% | |
Democrat | 46 | 0.37% | |
| Total Votes | 12,371 | 100% | |
| Douglas | |||
Democrat | 15 | 0.53% | |
Democrat | 1,340 | 47.33% | |
Democrat | 5 | 0.18% | |
Democrat | 54 | 1.91% | |
Democrat | 6 | 0.21% | |
Democrat | 8 | 0.28% | |
Democrat | 1,394 | 49.24% | |
Democrat | 9 | 0.32% | |
| Total Votes | 2,831 | 100% | |
| Ferry | |||
Democrat | 2 | 0.24% | |
Democrat | 362 | 44.2% | |
Democrat | 3 | 0.37% | |
Democrat | 17 | 2.08% | |
Democrat | 6 | 0.73% | |
Democrat | 11 | 1.34% | |
Democrat | 415 | 50.67% | |
Democrat | 3 | 0.37% | |
| Total Votes | 819 | 100% | |
| Franklin | |||
Democrat | 14 | 0.36% | |
Democrat | 2,023 | 52.46% | |
Democrat | 6 | 0.16% | |
Democrat | 116 | 3.01% | |
Democrat | 7 | 0.18% | |
Democrat | 11 | 0.29% | |
Democrat | 1,650 | 42.79% | |
Democrat | 29 | 0.75% | |
| Total Votes | 3,856 | 100% | |
| Garfield | |||
Democrat | 4 | 1.54% | |
Democrat | 127 | 49.03% | |
Democrat | 9 | 3.47% | |
Democrat | 9 | 3.47% | |
Democrat | 1 | 0.39% | |
Democrat | 0% | ||
Democrat | 109 | 42.08% | |
Democrat | 0% | ||
| Total Votes | 259 | 100% | |
| Grant | |||
Democrat | 25 | 0.5% | |
Democrat | 2,615 | 52.27% | |
Democrat | 8 | 0.16% | |
Democrat | 107 | 2.14% | |
Democrat | 26 | 0.52% | |
Democrat | 16 | 0.32% | |
Democrat | 2,186 | 43.69% | |
Democrat | 20 | 0.4% | |
| Total Votes | 5,003 | 100% | |
| Grays Harbor | |||
Democrat | 23 | 0.25% | |
Democrat | 4,958 | 54.32% | |
Democrat | 17 | 0.19% | |
Democrat | 192 | 2.1% | |
Democrat | 10 | 0.11% | |
Democrat | 61 | 0.67% | |
Democrat | 3,846 | 42.13% | |
Democrat | 21 | 0.23% | |
| Total Votes | 9,128 | 100% | |
| Island | |||
Democrat | 33 | 0.28% | |
Democrat | 4,862 | 40.96% | |
Democrat | 11 | 0.09% | |
Democrat | 216 | 1.82% | |
Democrat | 18 | 0.15% | |
Democrat | 89 | 0.75% | |
Democrat | 6,604 | 55.63% | |
Democrat | 38 | 0.32% | |
| Total Votes | 11,871 | 100% | |
| Jefferson | |||
Democrat | 18 | 0.25% | |
Democrat | 2,635 | 36.84% | |
Democrat | 6 | 0.08% | |
Democrat | 93 | 1.3% | |
Democrat | 14 | 0.2% | |
Democrat | 183 | 2.56% | |
Democrat | 4,180 | 58.44% | |
Democrat | 24 | 0.34% | |
| Total Votes | 7,153 | 100% | |
| King | |||
Democrat | 341 | 0.19% | |
Democrat | 75,717 | 42.02% | |
Democrat | 87 | 0.05% | |
Democrat | 2,175 | 1.21% | |
Democrat | 198 | 0.11% | |
Democrat | 1,157 | 0.64% | |
Democrat | 100,107 | 55.56% | |
Democrat | 394 | 0.22% | |
| Total Votes | 180,176 | 100% | |
| Kitsap | |||
Democrat | 103 | 0.33% | |
Democrat | 13,046 | 42.24% | |
Democrat | 32 | 0.1% | |
Democrat | 518 | 1.68% | |
Democrat | 63 | 0.2% | |
Democrat | 157 | 0.51% | |
Democrat | 16,813 | 54.43% | |
Democrat | 155 | 0.5% | |
| Total Votes | 30,887 | 100% | |
| Kittitas | |||
Democrat | 19 | 0.43% | |
Democrat | 2,083 | 47.47% | |
Democrat | 5 | 0.11% | |
Democrat | 83 | 1.89% | |
Democrat | 11 | 0.25% | |
Democrat | 26 | 0.59% | |
Democrat | 2,145 | 48.88% | |
Democrat | 16 | 0.36% | |
| Total Votes | 4,388 | 100% | |
| Klickitat | |||
Democrat | 11 | 0.36% | |
Democrat | 1,413 | 46.09% | |
Democrat | 5 | 0.16% | |
Democrat | 83 | 2.71% | |
Democrat | 14 | 0.46% | |
Democrat | 19 | 0.62% | |
Democrat | 1,509 | 49.22% | |
Democrat | 12 | 0.39% | |
| Total Votes | 3,066 | 100% | |
| Lewis | |||
Democrat | 30 | 0.41% | |
Democrat | 3,563 | 48.46% | |
Democrat | 15 | 0.2% | |
Democrat | 183 | 2.49% | |
Democrat | 25 | 0.34% | |
Democrat | 32 | 0.44% | |
Democrat | 3,477 | 47.29% | |
Democrat | 27 | 0.37% | |
| Total Votes | 7,352 | 100% | |
| Lincoln | |||
Democrat | 2 | 0.16% | |
Democrat | 585 | 46.28% | |
Democrat | 0% | ||
Democrat | 44 | 3.48% | |
Democrat | 5 | 0.4% | |
Democrat | 8 | 0.63% | |
Democrat | 618 | 48.89% | |
Democrat | 2 | 0.16% | |
| Total Votes | 1,264 | 100% | |
| Mason | |||
Democrat | 47 | 0.52% | |
Democrat | 4,470 | 49.78% | |
Democrat | 8 | 0.09% | |
Democrat | 187 | 2.08% | |
Democrat | 14 | 0.16% | |
Democrat | 40 | 0.45% | |
Democrat | 4,190 | 46.66% | |
Democrat | 24 | 0.27% | |
| Total Votes | 8,980 | 100% | |
| Okanogan | |||
Democrat | 19 | 0.42% | |
Democrat | 1,787 | 39.78% | |
Democrat | 7 | 0.16% | |
Democrat | 106 | 2.36% | |
Democrat | 15 | 0.33% | |
Democrat | 36 | 0.8% | |
Democrat | 2,497 | 55.59% | |
Democrat | 25 | 0.56% | |
| Total Votes | 4,492 | 100% | |
| Pacific | |||
Democrat | 20 | 0.46% | |
Democrat | 2,271 | 52.57% | |
Democrat | 5 | 0.12% | |
Democrat | 123 | 2.85% | |
Democrat | 4 | 0.09% | |
Democrat | 26 | 0.6% | |
Democrat | 1,849 | 42.8% | |
Democrat | 22 | 0.51% | |
| Total Votes | 4,320 | 100% | |
| Pend Oreille | |||
Democrat | 6 | 0.39% | |
Democrat | 766 | 49.26% | |
Democrat | 2 | 0.13% | |
Democrat | 48 | 3.09% | |
Democrat | 3 | 0.19% | |
Democrat | 7 | 0.45% | |
Democrat | 715 | 45.98% | |
Democrat | 8 | 0.51% | |
| Total Votes | 1,555 | 100% | |
| Pierce | |||
Democrat | 208 | 0.26% | |
Democrat | 41,259 | 51.05% | |
Democrat | 66 | 0.08% | |
Democrat | 1,412 | 1.75% | |
Democrat | 106 | 0.13% | |
Democrat | 274 | 0.34% | |
Democrat | 37,328 | 46.18% | |
Democrat | 173 | 0.21% | |
| Total Votes | 80,826 | 100% | |
| San Juan | |||
Democrat | 12 | 0.29% | |
Democrat | 1,155 | 27.59% | |
Democrat | 3 | 0.07% | |
Democrat | 60 | 1.43% | |
Democrat | 12 | 0.29% | |
Democrat | 92 | 2.2% | |
Democrat | 2,821 | 67.38% | |
Democrat | 32 | 0.76% | |
| Total Votes | 4,187 | 100% | |
| Skagit | |||
Democrat | 33 | 0.26% | |
Democrat | 5,201 | 40.2% | |
Democrat | 13 | 0.1% | |
Democrat | 264 | 2.04% | |
Democrat | 31 | 0.24% | |
Democrat | 113 | 0.87% | |
Democrat | 7,245 | 56% | |
Democrat | 38 | 0.29% | |
| Total Votes | 12,938 | 100% | |
| Skamania | |||
Democrat | 5 | 0.41% | |
Democrat | 559 | 45.52% | |
Democrat | 3 | 0.24% | |
Democrat | 47 | 3.83% | |
Democrat | 2 | 0.16% | |
Democrat | 6 | 0.49% | |
Democrat | 603 | 49.1% | |
Democrat | 3 | 0.24% | |
| Total Votes | 1,228 | 100% | |
| Snohomish | |||
Democrat | 141 | 0.21% | |
Democrat | 32,753 | 47.82% | |
Democrat | 57 | 0.08% | |
Democrat | 1,019 | 1.49% | |
Democrat | 100 | 0.15% | |
Democrat | 294 | 0.43% | |
Democrat | 33,958 | 49.57% | |
Democrat | 177 | 0.26% | |
| Total Votes | 68,499 | 100% | |
| Spokane | |||
Democrat | 217 | 0.38% | |
Democrat | 27,594 | 47.93% | |
Democrat | 61 | 0.11% | |
Democrat | 1,164 | 2.02% | |
Democrat | 91 | 0.16% | |
Democrat | 221 | 0.38% | |
Democrat | 28,072 | 48.76% | |
Democrat | 152 | 0.26% | |
| Total Votes | 57,572 | 100% | |
| Stevens | |||
Democrat | 21 | 0.45% | |
Democrat | 2,079 | 44.21% | |
Democrat | 9 | 0.19% | |
Democrat | 103 | 2.19% | |
Democrat | 9 | 0.19% | |
Democrat | 24 | 0.51% | |
Democrat | 2,449 | 52.07% | |
Democrat | 9 | 0.19% | |
| Total Votes | 4,703 | 100% | |
| Thurston | |||
Democrat | 92 | 0.25% | |
Democrat | 15,532 | 42.58% | |
Democrat | 31 | 0.08% | |
Democrat | 662 | 1.81% | |
Democrat | 53 | 0.15% | |
Democrat | 333 | 0.91% | |
Democrat | 19,631 | 53.81% | |
Democrat | 146 | 0.4% | |
| Total Votes | 36,480 | 100% | |
| Total | |||
Democrat | 1,883 | 0.27% | |
Democrat | 315,744 | 45.67% | |
Democrat | 618 | 0.09% | |
Democrat | 11,892 | 1.72% | |
Democrat | 1,071 | 0.15% | |
Democrat | 4,021 | 0.58% | |
Democrat | 354,112 | 51.22% | |
Democrat | 2,040 | 0.3% | |
| Total Votes | 691,381 | 100% | |
| Wahkiakum | |||
Democrat | 5 | 0.81% | |
Democrat | 300 | 48.78% | |
Democrat | 0% | ||
Democrat | 12 | 1.95% | |
Democrat | 0% | ||
Democrat | 2 | 0.33% | |
Democrat | 295 | 47.97% | |
Democrat | 1 | 0.16% | |
| Total Votes | 615 | 100% | |
| Walla Walla | |||
Democrat | 31 | 0.51% | |
Democrat | 2,641 | 43.83% | |
Democrat | 7 | 0.12% | |
Democrat | 162 | 2.69% | |
Democrat | 10 | 0.17% | |
Democrat | 21 | 0.35% | |
Democrat | 3,134 | 52.02% | |
Democrat | 19 | 0.32% | |
| Total Votes | 6,025 | 100% | |
| Whatcom | |||
Democrat | 68 | 0.28% | |
Democrat | 9,037 | 37% | |
Democrat | 21 | 0.09% | |
Democrat | 356 | 1.46% | |
Democrat | 58 | 0.24% | |
Democrat | 277 | 1.13% | |
Democrat | 14,510 | 59.41% | |
Democrat | 97 | 0.4% | |
| Total Votes | 24,424 | 100% | |
| Whitman | |||
Democrat | 7 | 0.18% | |
Democrat | 1,542 | 38.95% | |
Democrat | 2 | 0.05% | |
Democrat | 66 | 1.67% | |
Democrat | 3 | 0.08% | |
Democrat | 25 | 0.63% | |
Democrat | 2,294 | 57.94% | |
Democrat | 20 | 0.51% | |
| Total Votes | 3,959 | 100% | |
| Yakima | |||
Democrat | 62 | 0.39% | |
Democrat | 8,471 | 53.73% | |
Democrat | 18 | 0.11% | |
Democrat | 309 | 1.96% | |
Democrat | 21 | 0.13% | |
Democrat | 37 | 0.23% | |
Democrat | 6,792 | 43.08% | |
Democrat | 55 | 0.35% | |
| Total Votes | 15,765 | 100% | |